|
|
|
CHAPTER 9: STEADY RAPIDLY VARIED FLOW |
9.1 THE SHARP-CRESTED WEIR
|
|
Rapidly varied flow differs from gradually varied flow (Chapter 7) in the greater curvature of the streamlines. In extreme cases, the flow is virtually broken, resulting in high levels of turbulence and associated energy loss.
The following characteristics describe rapidly varied flow:
The curvature of the streamlines is so pronounced that the pressure distribution cannot be assumed to be hydrostatic.
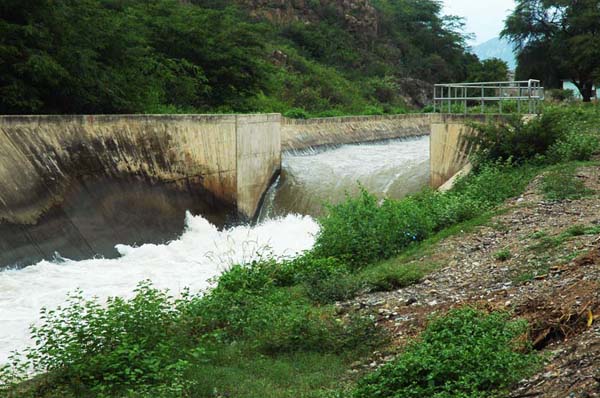
Unlike gradually varied flow, changes in flow variables take place within a relatively short distance (Fig. 9-1).
The boundary friction is small compared to the other forces, and often negligible.
The flow characteristics are fixed by the usually rigid boundary geometry.
The velocity distribution coefficients α and β are much greater than unity (1) and cannot be determined accurately.
Separation zones, eddies, and rollers tend to complicate the flow pattern, with flow often confined to separation zones.
To date, there is no theoretical solution for rapidly varied flow. In lieu of theory, empirical relations are used in many applications.
|
The sharp-crested weir
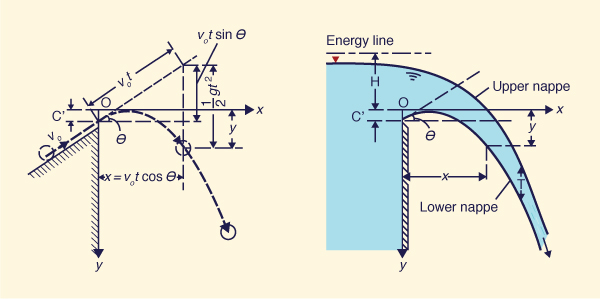
The sharp-crested weir is a measuring device in open-channel flow (Chapter 4). It is also the simplest form of overflow spillway. The profile of the spillway can be made to match the shape of the lower surface of the flow nappe. The shape of the flow nappe may be interpreted by the principle of the projectile (Chow, 1959) (Fig. 9-2).
According to this principle, the horizontal velocity component of the flow is constant, and the only force acting on the nappe is the gravitational force. In time t, a particle of water in the lower surface of the nappe will travel a horizontal distance x (from the face of the weir) equal to:
|
| x = vo t cos θ | (9-1) |
In the same time, the particle will travel a vertical distance y equal to:
y = - vo t sin θ + (1/2) g t 2 + C' | (9-2) |
in which g = gravitational acceleration, and C' is the value of y at x = 0. The constant C' may be taken as the vertical distance between the highest point of the nappe and the elevation of the crest.
Eliminating t from Eqs. 9-1 and 9-2:
|
y x x ____ = A (____)2 + B (____) + C H H H | (9-3) |
in which:
|
g H A = ________________ 2 vo2 cos2 θ | (9-4) |
|
B = - tan θ | (9-5) |
|
C' C = ______ H | (9-6) |
Assuming the vertical thickness of the nappe T, an additional term may be added to Eq. 9-5 to yield the nappe equation:
|
y x x ____ = A (____)2 + B (____) + C + D H H H | (9-7) |
in which D = T / H .
Discharge of the sharp-crested weir
A common formula for the discharge over a sharp-crested weir is:
| Q = C L H 3/2 | (9-8) |
in which C = discharge coefficient, L = effective length of the weir crest, and H = measured head above the crest, excluding the velocity head. Discharge coefficients for various types of sharp-crested weirs are given in Chapter 4.
9.2 CREST SHAPE OF OVERFLOW SPILLWAY
|
|
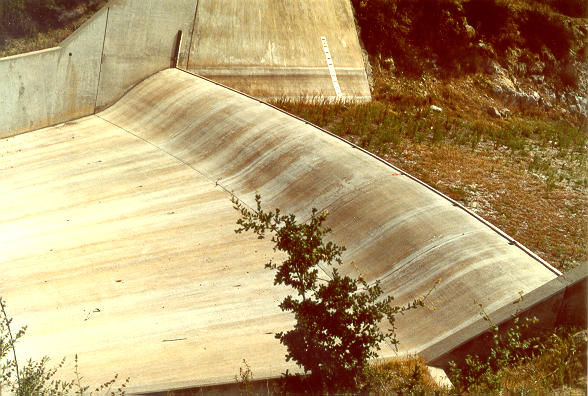
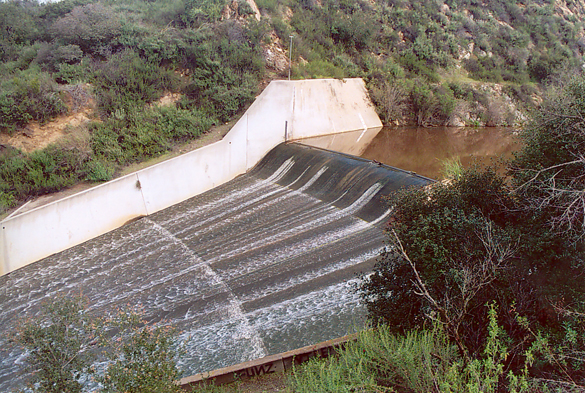
The spillway shape shown in Fig. 9-3 is referred to as an ogee shape, because it resembles an ogee curve, shaped somewhat like an S, consisting of two archs that curve in opposite sides, so that the ends are approximately parallel. In practice, notwithstanding the weir shape, negative pressures may develop in an ogee spillway. Excessive negative pressures may lead to cavitation damage and are, therefore, to be controlled.
|
|
WES spillway shapes
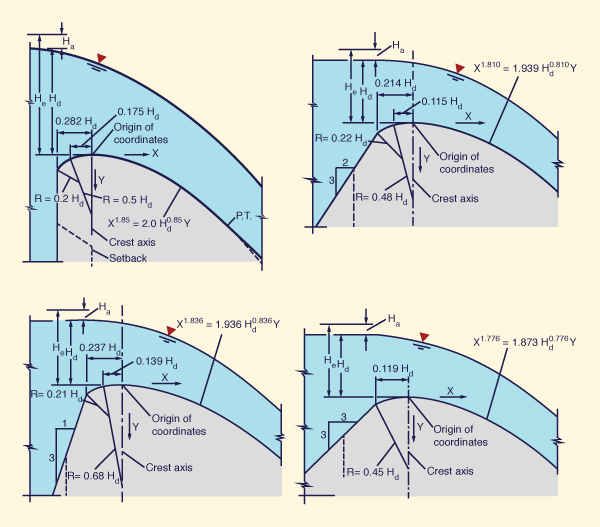
The U.S. Army Corps of Engineers has developed several standard shapes at its Waterways Experiment Station, in Vicksburg, Mississippi. These shapes, shown in Fig. 9-4, are referred to as the WES standard spillway shapes.
|
The WES shapes follow the equation:
| X n = K Hd n-1 Y | (9-9) |
in which X and Y are the coordinates of the crest profile, with the origin of coordinates at the highest point of the crest; Hd = design head excluding the velocity head of the approach flow; and K and n are parameters which depend on the slope of the upstream face. The values of K and n are shown in Table 9-1. For intermediate values, interpolation is possible.
| Table 9-1 Values of K and n (Eq. 9-9). | ||||||||||||||
| Slope on upstream face | K | n
| Vertical
| 2.000
| 1.850
| 3 V : 1 H
| 1.936
| 1.836
| 3 V : 2 H
| 1.939
| 1.810
| 3 V : 3 H
| 1.873
| 1.776
| |
The upstream face of the spillway may sometimes be designed to set back, as shown by the dashed lines of Fig. 9.4. The set back will not affect the shape of the crest, provided the modification begins with at least one-half of the total head He below the origin. Below this depth, the vertical velocities are small, and the corresponding effect on the nappe profile is negligible.
For WES shapes, the discharge over the spillway is:
| Q = C L He 3/2 | (9-10) |
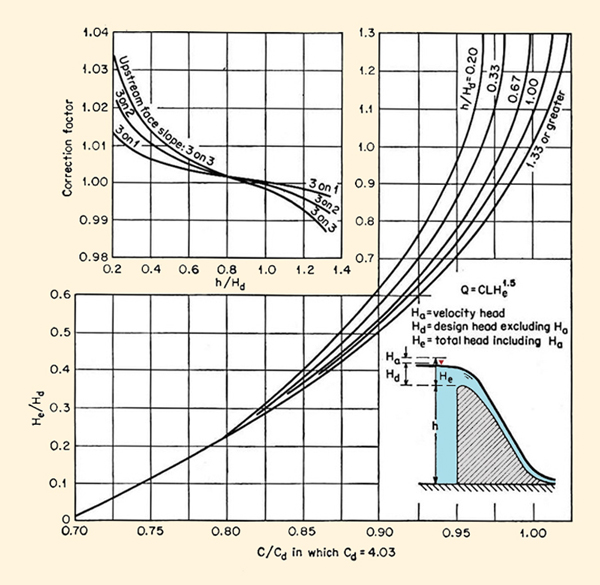
in which He = total energy head on the crest, including the velocity head in the approach channel. Model test have shown that the effect of the approach velocity is negligible when the height h of the spillway is greater than 1.33 Hd, where Hd = design head, excluding the approach velocity. Under this condition, the coefficient of discharge, in U.S. Customary units, is Cd = 4.03.
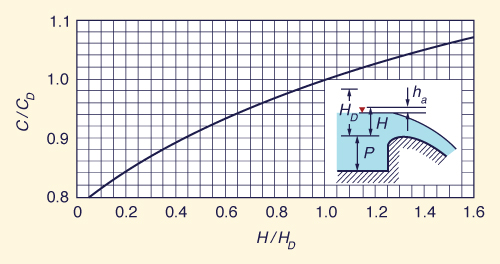
For low spillways, where h/Hd < 1.33, the approach velocity will have appreciable effect on the discharge and, therefore, on the nappe profile. Figure 9-5 shows the effect of the approach velocity on the relationship between (He /Hd) and (C /Cd) for WES spillways with a vertical upstream face. From Fig. 9-5, for h /Hd ≥ 1.33 and He > Hd, the ratio C/Cd > 1. It is seen that the ratio C /Cd varies from 0.70 near crest level (He /Hd ≅ 0) to 1.05 for He /Hd > 1.3. Thus, effectively, C varies from 2.82 to 4.23 (U.S. Customary units).
For a sloping upstream face, C is multiplied by the correction
factor shown in the top-left side of
|
|
WES spillway: Design example
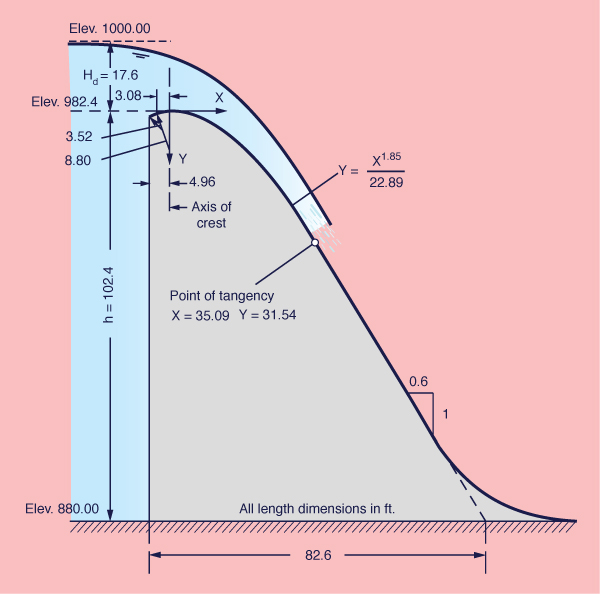
Determine the crest elevation and the shape of an overflow spillway section (WES standard spillway shape) having a vertical upstream face and a crest length
L = 250 ft. The design discharge is
Solution
|
Example 9-1.
|
Ogee-type spillways
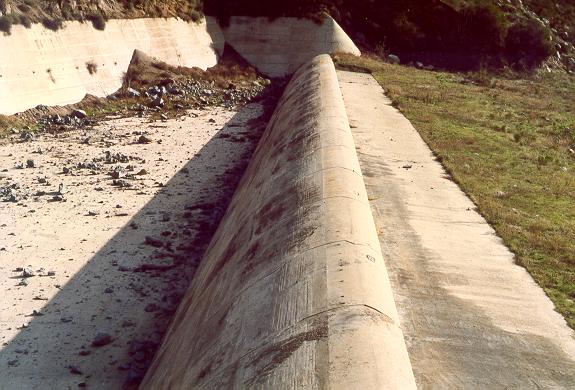
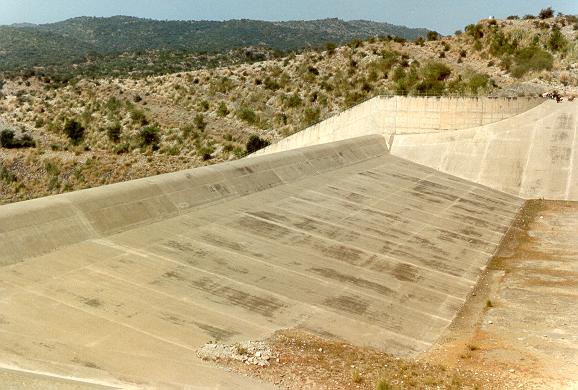
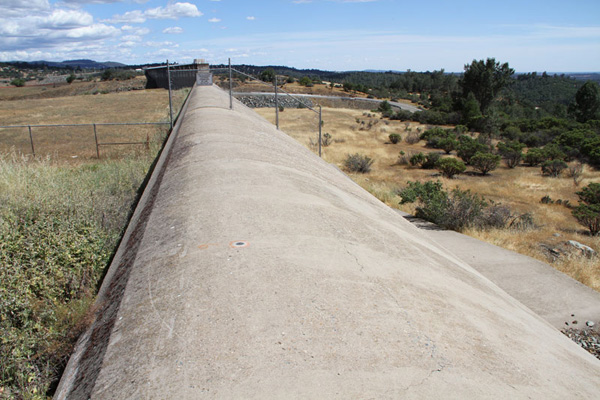
Figure 9-7 shows several ogee-type spillways.
This type of spillway is preferred for high dams, because their discharge coefficient (C = 4.03 in U.S. Customary units and C = 2.22 in SI units)
is substantially higher than the theoretical value for broad-crested
weirs (C = 3.087 in U.S. Customary units and
|
|
|
| Click -here- to view a video on the Arizona spillway of Hoover Dam. |
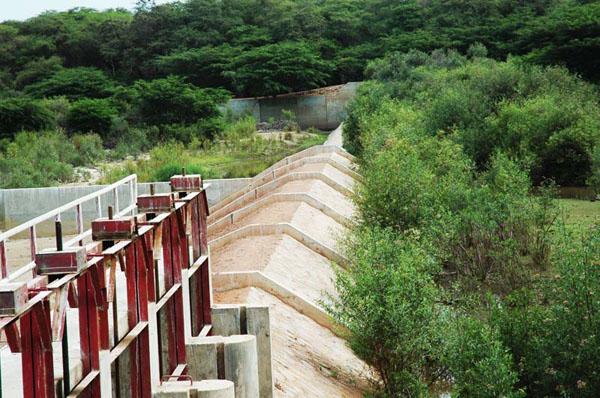
Broad-crested spillways
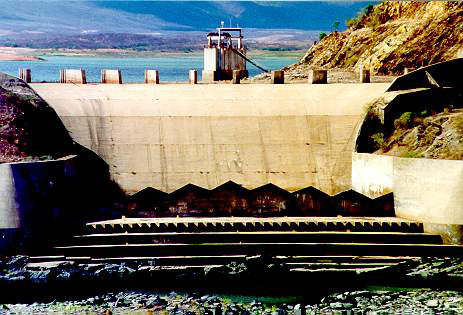
Figure 9-8 shows two broad-crested spillways. The 8000-ft long relief weir (emergency spillway) of the Boerasirie Conservancy, shown in Fig. 9-8 (a), has been designed with discharge coefficient varying from C = 1.45 at spill level to C = 1.78 at the design head Hd = 0.215 m (discharge coefficient in SI units). The Valle Grande dam, shown in Fig. 9-8 (b), is an off-stream storage reservoir, with a small contributing drainage area; thus, no major floods are expected and the broad-crested weir is considered sufficient to handle the design peak flow.
|
|
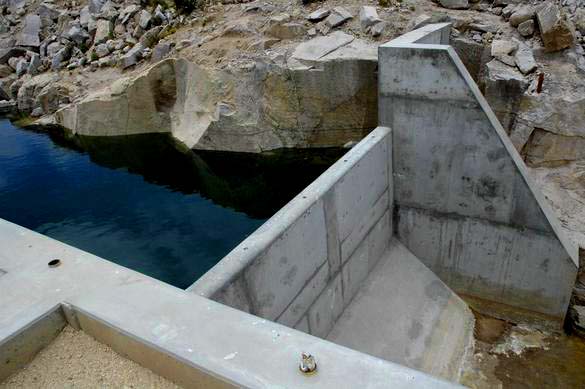
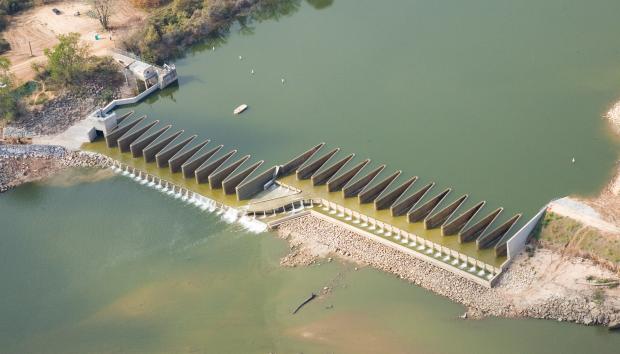
Labyrinth spillways
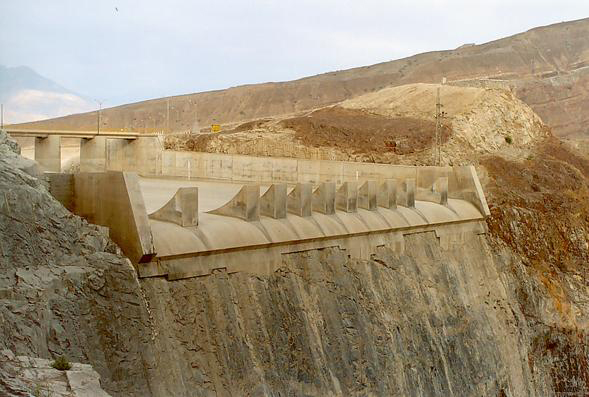
The labyrinth spillway is used to increase the effective length of the weir crest, when warranted due to an increased risk of hydrologic failure. Figure 9-9 shows three examples of labyrinth spillways. The labyrinth works well at the design stage above spillway crest. However, for stages that are higher than the design stage, the effective length eventually reduces to the actual length and the labyrinth ceases to provide the desired advantage.
|
|
|
Fuse spillways
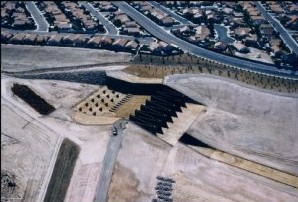
A fuse spillway or fuse plug is an embankment designed to wash out in a predictable and controlled manner when a capacity in excess of the normal capacity of the service spillway and outlet works is required (Pugh and Gray, 1984). According to the U.S. Bureau of Reclamation, fuse plug designs have been selected for the Bartlett and Horseshoe dams, on the Verde River, Arizona. The fuse plug for Bartlett Dam is designed with an erosion resistant invert and abutment structure to pass 10,100 m3/s. Three erodible embankment sections will operate in sequence. The Horseshoe Dam fuse plug is designed to pass 6,850 m3/s through three 44- to 52-m-long openings 6.0-m to 7.9-m high.
|
Other spillways features
Other spillway features include rubber-gated spillways (Fig. 9-11), sky-jump spillways (Fig. 9-12), and baffle-dissipation structures (Fig. 9-13).
|
|
|
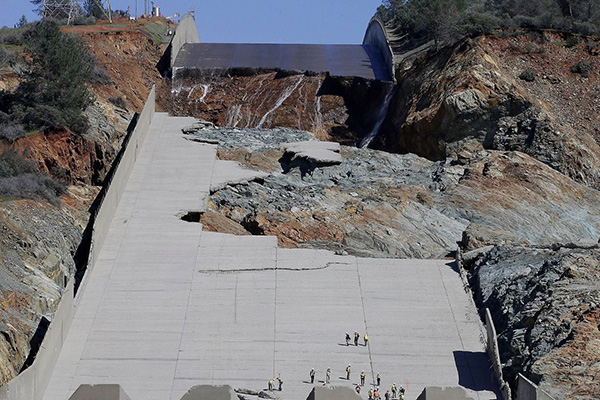
In February 2017, both flood control and emergency spillways at Lake Oroville, in northern California, failed
after 12.8 in of rain fell between February 6 and 10 on the Feather river basin.
The timeline of the events that led to the failure is documented in the video
Lake Oroville Spillway
Incident Timeline.
By September 2018,
the cost of repairs and other issues stemming from the failure had climbed to
|
9.3 RATING OF SPILLWAYS
|
|
At the design discharge, the pressure on the spillway crest is close to atmospheric. The design head HD, which includes the velocity head, corresponds to the design discharge. Flow rates less than the design flow rate will produce pressures on the spillway face above the atmospheric pressure, while flow rates greater than the design flow rate will produce subatmospheric pressures.
The discharge over an ungated ogee spillway may be given as follows (Roberson et al., 1998):
| QD = CD (2 g)1/2 L HD 3/2 | (9-11) |
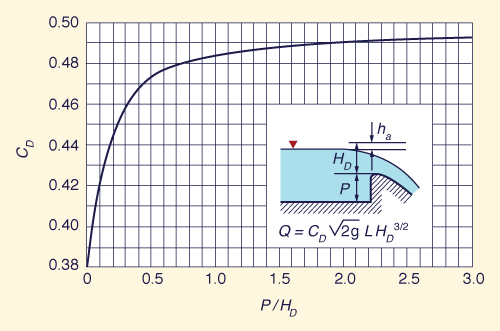
in which QD = design discharge, CD = dimensionless design discharge coefficient, L = crest length perpendicular to the flow, and HD = total design head on the crest, including the approach velocity head ha.
Figure 9-15 shows values of CD as a function of P/HD, in which P = height of the spillway crest measured from the channel bed. Note that for large values of P/HD, the value of CD approaches asymptotically a value of CD = 0.492.
In general, the discharge over an ogee-type spillways is:
| Q = C (2 g)1/2 L H 3/2 | (9-12) |
in which Q = discharge, C = dimensionless discharge coefficient, L = crest length perpendicular to the flow, and H = head on the crest, including the approach velocity head.
|
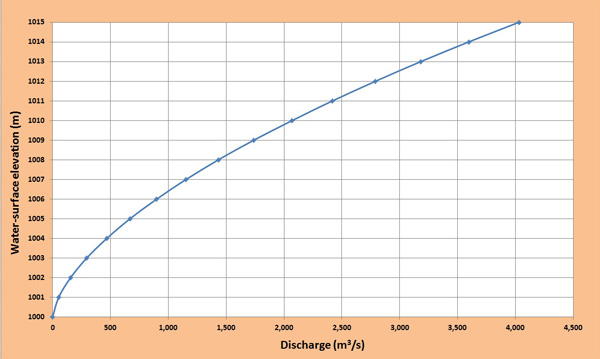
The ratio C/CD varies as a function of H/HD as shown in Fig. 9-16. Figures 9-15 and 9-16 may be used to develop a spillway rating curve, i.e., a relation between flow rate Q and head above spillway crest H. If the actual head H exceeds the design head HD, subatmospheric pressures will develop on the spillway, and this may lead to cavitation damage. To prevent cavitation damage, the negative pressure head should be kept within -20 ft.
|
|
Spillway rating: Example
Determine the rating curve for an ogee-type spillway with length L = 30 m.
The design head is: HD = 10 m.
The freeboard is: Fb = 5 m.
The spillway crest elevation is at Solution
The calculations are summarized in Table 9-2.
| |||||||||||||||||||||||||||||||||||||||||||||||||||||||||||||||||||||||||||||||||||||||||||||||||||||||||||||||||||||
Example 9-2
|
9.4 THE HYDRAULIC JUMP
|
|
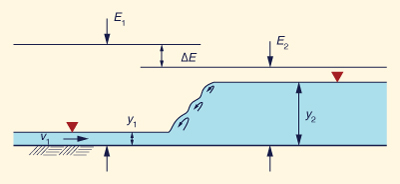
The hydraulic jump is an open-channel flow phenomenon where the flow changes suddenly from supercritical to subcritical (Fig. 9-18). The equation for the hydraulic jump is developed for a horizontal channel, for which the jump becomes stationary, i.e., it occurs in a specific place in the channel. A nonstationary hydraulic jump may occur in a channel of finite (nonzero) slope. In practice, the stationary hydraulic jump is preferred over the nonstationary or "moving" jump.
|
The hydraulic jump is used in the following applications:
To dissipate energy in water flowing over dams, weirs, and other hydraulic structures, to prevent downstream scouring of the structures.
To recover hydraulic head on the downstream side of a measuring flume.
To increase weight on an apron and reduce uplift pressures under a masonry structure.
To aerate water for purposes of water purification.
Hydraulic jump equation
A hydraulic jump will form in a rectangular channel if the following equation is satisfied (See
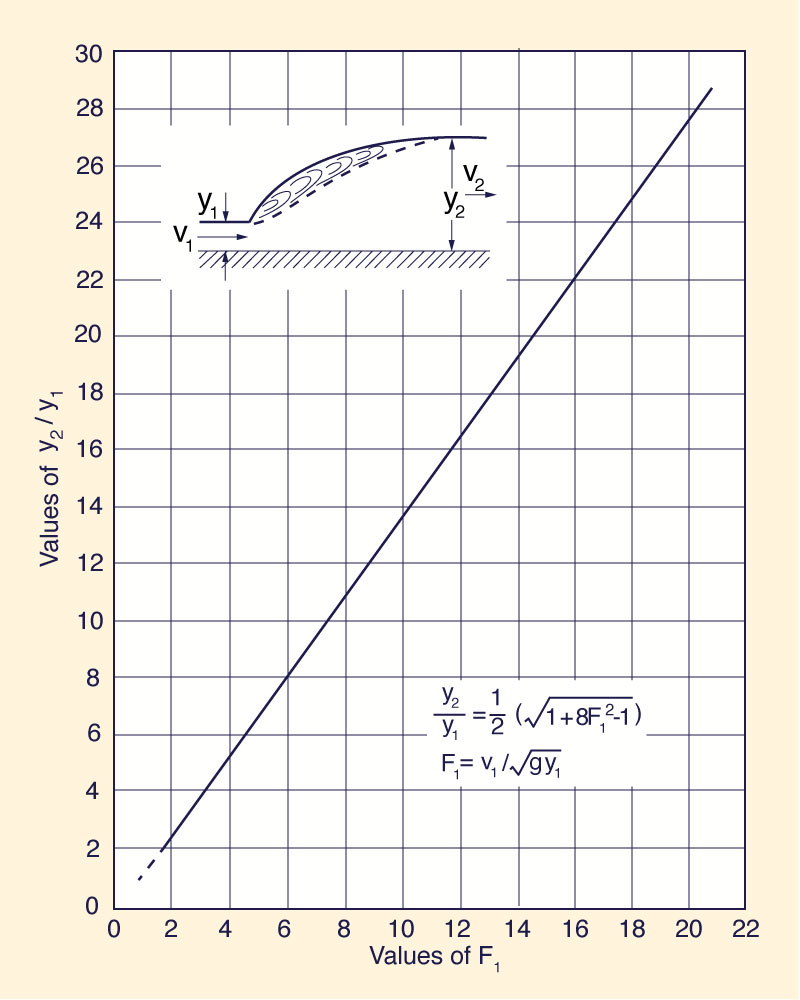
| y2 1 ____ = ____ [ (1 + 8 F1 2 )1/2 - 1 ] y1 2 | (9-13) |
where y1 = upstream flow depth (supercritical), y2 = downstream flow depth (subcritical), and F1 = Froude number of the upstream flow. The depth y1 is the initial depth and y2 is the sequent depth.
The hydraulic jump relation (Eq. 9-13) is shown in Fig. 9-19.
Note that for Froude number
|
Example 9-3
|
Types of hydraulic jump
Hydraulic jumps are classified as shown in Table 9-3 (Chow, 1959).
| Table 9-3 Types of hydraulic jump. | ||
| Upstream Froude number F1 | Type of jump | Graphical description |
| 1.0 - 1.7 | Undular jump | 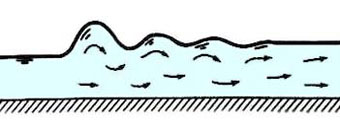 |
| 1.7 - 2.5 | Weak jump | 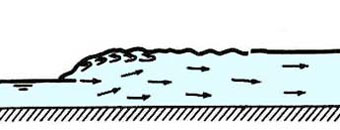 |
| 2.5 - 4.5 | Oscillating jump | 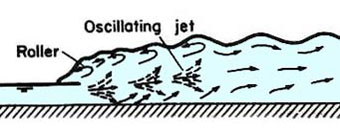 |
| 4.5 - 9.0 | Steady jump | 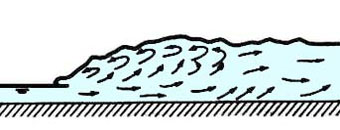 |
| > 9.0 | Strong jump | 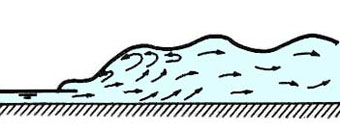 |
Characteristics of the hydraulic jump
The energy loss is:
|
(y2 - y1)3 ΔE = E1 - E2 = ______________ 4 y1 y2 | (9-14) |
| [See also Lab video: The hydraulic jump]. |
The relative energy loss is:
|
ΔE E2 ______ = 1 - ______ E1 E1 | (9-15) |
The efficiency of the jump is (see box below):
|
E2 ( 1 + 8 F12 )3/2 - 4 F12 + 1 ______ = _______________________________ E1 8 F12 ( 2 + F12 ) | (9-16) |
The height of the jump is:
|
hj = y2 - y1 | (9-17) |
The relative height of the jump is:
|
hj y2 y1 _____ = _____ - _____ E1 E1 E1 | (9-18) |
where y1 /E1 = relative initial depth, and
y2 /E1 = relative sequent depth.
In terms of the Froude number of the upstream flow, the relative height of the jump is:
|
hj ( 1 + 8 F12 )1/2 - 3 ______ = _______________________ E1 2 + F12 | (9-19) |
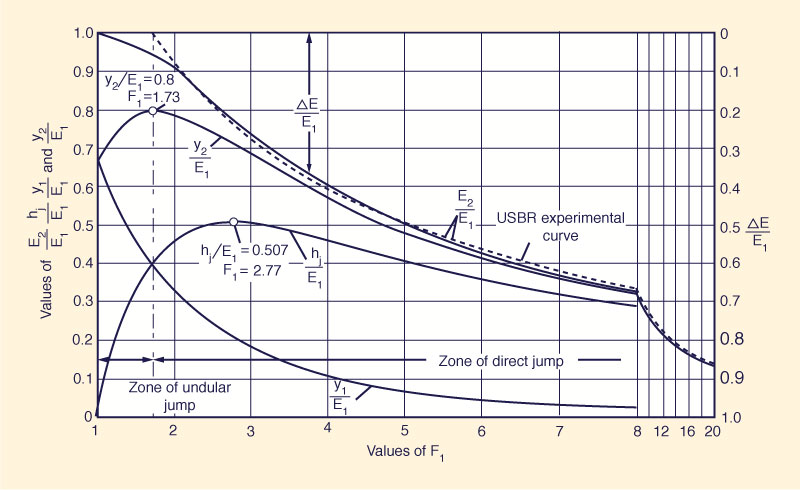
Figure 9-20 is a graphical portrayal of the characteristics of the hydraulic jump. Note the following:
The relative sequent depth reaches a maximum value y2 /E1 = 0.8 for F1 = 1.73.
The relative height of the jump reaches a maximum value hj /E1 = 0.507 for F1 = 2.77.
It is confirmed that for F1 = 1, the initial depth y1 is equal to 2/3 (0.667) of the specific energy E1.
For F > 3, the changes in all characteristics become gradual.
|
|
Efficiency of the hydraulic
jump
With reference to Fig. 9-21, the efficiency of the hydraulic jump is:
F1 = v1 / (gy1)1/2
F2 = v2 / (gy2)1/2
v1y1 = v2 y2
v12y12 = v22 y22
F12 y13 = F22 y23
F22 = F12 / (y2
/ y1)3
The hydraulic jump equation is (Eq. 9-13):
y2 / y1 = (1/2) [ (1 + 8 F12)1/2 - 1 ]
N 2 = 1 + 8 F12
y2 / y1 = (1/2) [ N - 1]
2 (y2 / y1) = N - 1
(y2 / y1)3 = (1/8) [ N - 1]3
2 (y2 / y1)3 = (1/4) [ N - 1]3
N = ( 1 + 8 F12)1/2
N 3 = ( 1 + 8 F12)3/2
N 2 - 1 = 8 F12
F12 = ( N 2 - 1) / 8
4 F12 = ( N 2 - 1) / 2
The efficiency of the hydraulic jump is:
E2/E1 = [ y2 + v22/(2g) ] / [ y1 + v12/(2g) ]
E2/E1 = [ y2(1 + F22/2) ] / [ y1(1 + F12/2) ]
E2/E1 = 2 (y2/y1) {1 + F12 / [ 2 (y2/y1)3] } / (2 + F12)
E2/E1 = (N - 1) {1 + (N 2 - 1) / [ 2 (N - 1)3 ] } / (2 + F12)
E2/E1 = (N 2 - 1)(N - 1) {1 + (N 2 - 1) / [ 2 (N - 1)3 ] } / [8 F12(2 + F12) ]
E2/E1 = [ (N 2 - 1)(N - 1) + (1/2)(N + 1)2 ] / [ 8 F12(2 + F12) ]
E2/E1 = { (N 3 - N 2 - N - 1) + [ (N 2/2) + N + (1/2)] } / [ 8 F12(2 + F12) ]
E2/E1 = { (N 3 - [(N 2 - 1)/2] + 1} / [ 8 F12 (2 + F12) ]
E2/E1 = [ (1 + 8 F12)3/2 - 4F12 + 1] / [ 8 F12(2 + F12) ] ANSWER.
|
Example 9-4
|
Example 9-5
|
Length of the hydraulic jump
The length of the hydraulic jump is defined as
the distance measured from the front face
to a point (on the water surface) located immediately
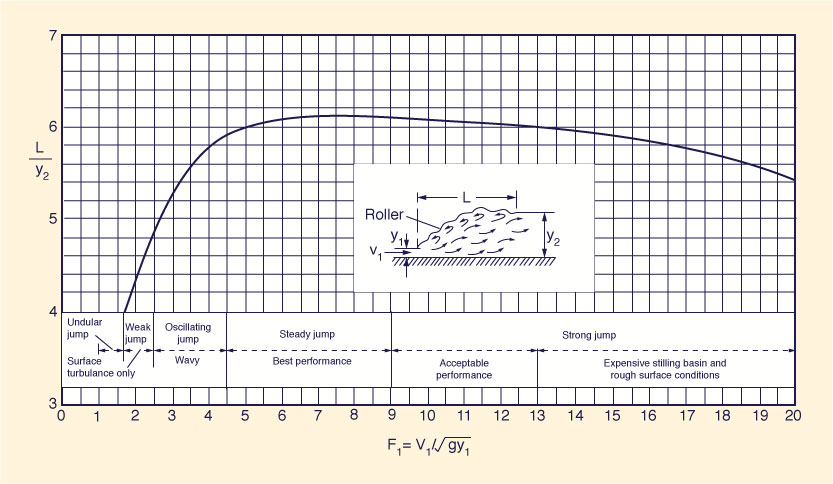
downstream of the roller (see insert of Fig. 9-21). The relative length of the jump L/y2 has been determined experimentally.
It varies from about 5.0 to 6.15 for a wide range of upstream Froude numbers.
Within the range 4.5 ≤ F1 ≤ 13,
the relative length of the jump is slightly greater than 6 (Fig. 9-22).
|
Profile of the hydraulic jump
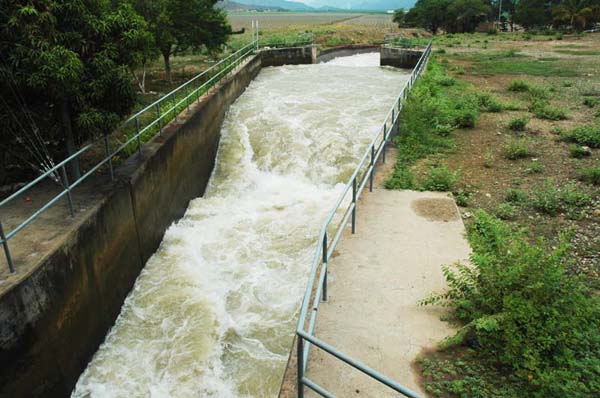
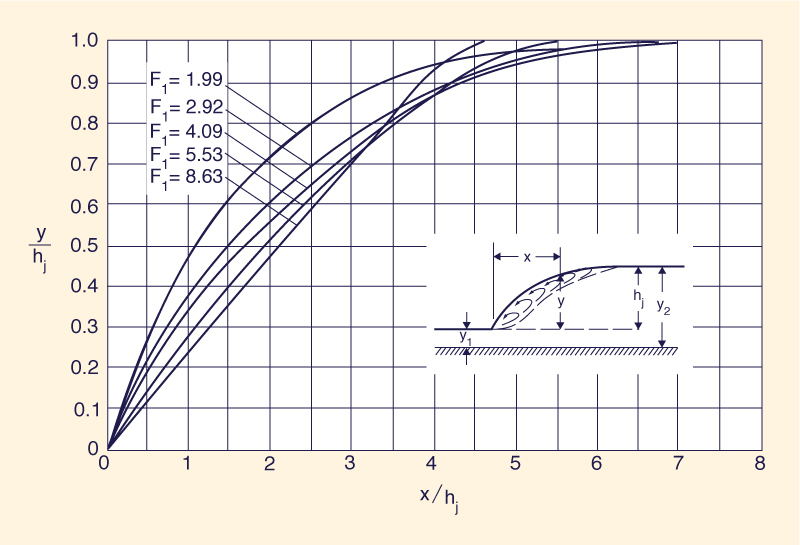
Experimental measurements have shown that the actual surface profile of the hydraulic jump varies somewhat with the upstream Froude number. The profiles may be plotted as dimensionless curves, as shown in Fig. 9-23. A closeup of a hydraulic jump is shown in Fig. 9-24.
|
|
QUESTIONS
|
|
How does rapidly varied flow differ from gradually varied flow?
Is there a theoretical solution of one-dimensional rapidly varied flow?
What is the exponent of the rating in a broad-crested weir?
What is the coefficient of the rating for high spillways in U.S. Customary units?
What does "ogee" stand for?
What is the rationale for the use of a labyrinth spillway?
What is the risk when flow over a spillway exceeds the design stage?
What flow condition produces a hydraulic jump?
Is the hydraulic jump equation linear or nonlinear?
How is the length of the hydraulic jump measured?
PROBLEMS
|
|
An emergency spillway is being considered for the Demerera Water Conservancy to safeguard the integrity of the dam under conditions of climate change (similar to Fig. 9-25). Assume that the existing relief sluices would be inoperable during a major flood due to high tailwater. Determine the length of the free-overflow spillway required to pass the Probable Maximum Flood (PMF). The following data is applicable:
- PMF 1-day duration: 428 mm
- Hydrologic abstraction: 18 mm
- Contributing drainage area: 582 km2
- Time base of the flood hydrograph: 3 days
- Embankment crest elevation: 18.288 m
- Spillway crest elevation: 17.526 m
- Freeboard: 0.3 m
- Weir discharge coefficient: 1.45
For simplicity, assume a triangular-shaped flood hydrograph. Use all the freeboard to contain the PMF.
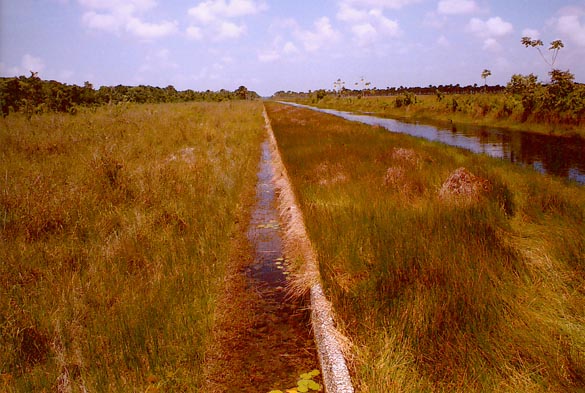
Fig. 9-25 The 8000-ft weir of the Boerasirie Water Conservancy.
Design an overflow-spillway section having a vertical upstream face and a crest length
L = 150 ft. The design discharge is Q = 50,000 ft3/s. The upstream water surface at design discharge is at Elev. 750 ft, and the average channel floor is at Elev. 650 ft (see Fig. 9-6 for graphical example).Use ONLINE OGEE RATING to determine the rating for an ogee spillway with length L = 15 m, design head Hd = 2 m, spillway crest elevation = 1045 m, river bed elevation = 1000 m, and freeboard Fb = 1 m. Neglect the approach velocity. What should be the spillway length to pass the Probable Maximum Flood QPMF = 250 m3/s while taking all the freeboard? Express spillway length to nearest 0.1 m by excess.
Prove Eq. 9-14.
Prove Eq. 9-19.
Calculate the energy loss in a hydraulic jump, given the sequent depths y1 = 0.58 m and
y2 = 2.688 m. Calculate the relative height of the hydraulic jump hj /E1 for F1 = 3.
Use ONLINE CHANNEL 11 to calculate the sequent depth y2 through a hydraulic jump when the discharge is q = 5 m2/s and the initial depth y1 = 0.58 m.
Use ONLINE CHANNEL 12 to determine the sequent depth y2 and energy loss ΔE through a hydraulic jump when the discharge is q = 10 ft2/s and the upstream flow depth is y1 = 0.5 ft.
Use ONLINE CHANNEL 16 to calculate the sequent depths through a hydraulic jump when the discharge is q = 10 ft2/s and the energy loss is ΔE = 3.287 ft.
Use ONLINE CHANNEL 16 to calculate the sequent depths through a hydraulic jump when the discharge is q = 5 m2/s and the energy loss is ΔE = 1.5 m.
Use ONLINE CHANNEL 18 to calculate the efficiency of the hydraulic jump E2/E1 for
q = 10 ft2/s and y1 = 0.5 ft.
REFERENCES
|
|
Chow, V. T. 1959. Open-channel Hydraulics. McGraw Hill, New York.
Roberson, J. A., J. J. Cassidy, and M. H. Chaudhry. 1998. Hydraulic Engineering. John Wiley and Sons, New York, Second edition.
Pugh, C. A., and E. W. Gray. 1984. Fuse Plug Embankments in Auxiliary Spillways - Developing Design Guidelines and Parameters, United States Committee on Large Dams (as cited in U.S. Bureau of Reclamation).
| http://openchannelhydraulics.sdsu.edu |
|
210913 17:00 |
