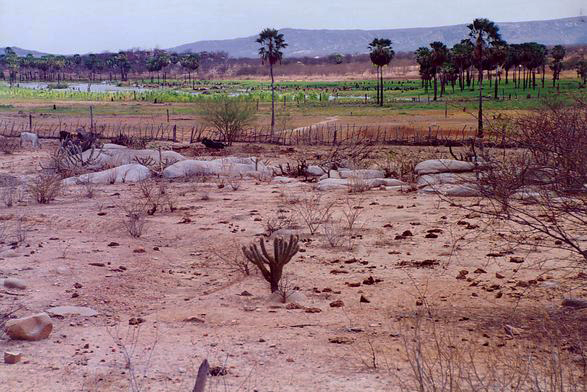
The contrast between arid and humid landscapes,
badlands of Rio Grande do Norte, Brazil.
|
THE 800-MM ISOHYET
Victor M. Ponce
San Diego State University, San Diego,
California
22 September 2023
ABSTRACT.
The world's climates may be broadly classified into: (1) arid,
and (2) humid; arid for mean annual precipitation less than 800 mm; humid for
greater than 800 mm. The 800-mm isohyet may possess an optimal
combination of water and nutrients: (1) plenty of water to satisfy
the demands of vegetation, and (2) a healthy array of nutrients,
in both quantity and quality, to fulfill the needs of the ecosystem.
Life near the 800-mm isohyet may prove to be generally healthier
for humans, and definitely more sustainable. The quantity of flying insects
and other annoying pests will be reduced, while virtually eliminating the
need for the disposal of additional waste salt. The latter may be created
due to the perceived need for irrigation of arid lands to satisfy
societal demands for additional food and fiber.
|
1. INTRODUCTION
Mean annual terrestrial
precipitation divides the Earth's
landscapes into two types: arid and humid.
On one hand, the Atacama desert, in Northern Chile, is a superarid desert,
with mean annual precipitation of 15 mm, effectively the driest in the world.
On the other hand, Mawsynram, in Meghalaya, Eastern India, is a superhumid forest,
with mean annual precipitation of 11,872 mm;
indeed, the wettest spot on Earth! This is a very broad range of variability;
however, the distribution
is not uniform across the world. Spatially and temporally averaged
annual precipitation is about 800 mm
(Ponce and others, 2000).
This threshold separates regions with
precipitation less than average from those with more than average.
Arid landscapes have limited vegetation, while
humid landscapes have profuse quantities of vegetation.
The question remains: Which one is to be preferred? An arid landscape, where water is limited?
Or a humid landscape, where water is plentiful? The answer is not simple.
A correct assessment requires that we examine the structure of
the biosphere so that all its components are carefully considered.
2. THE BIOSPHERE
The concept of biosphere is attributed to the Russian scientist
Vladimir Vernadsky (Hutchinson, 1970).
The biosphere is defined as that part of the Earth in which
life exists. The following properties describe the biosphere as a region:
(1) it features liquid water in substantial quantities, (2) it receives
an ample supply of energy from the sun, and (3) it has significant
interfaces between liquid, solid, and gaseous states of matter.
Life is shown to develop readily across the interfaces. All plants need: (1) water
from the surrounding environment, (2) carbon dioxide and oxygen from the air, and (3)
a great number of other elements, in solution in the soil pore water.
Water exists on the Earth's surface and subsurface in diverse locations and varying quantities,
depending on the season and the local and regional climate, geology, and geomorphology.
Carbon dioxide exists in the air in sufficient quantities to satisfy the needs of vegetation;
its current value is about 0.041%, and it is subject to a gradual and persistent
contemporary increase due to anthropogenic
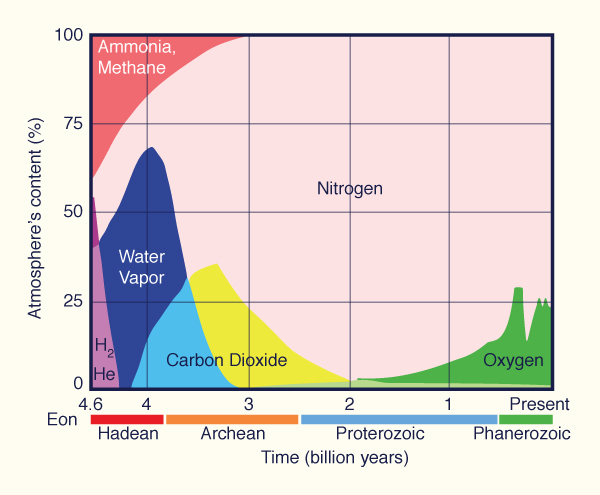
global warming. Oxygen exists in the air at about 21%, having fluctuated greatly across the eons (Fig. 1).
The fourth component consists of an array of chemical elements, normally in solution
in the soil pore water; these elements, essential for life, are referred to as nutrients.
The fundamental requirements for plant life
are:
(1) solar energy, the source of everything;
(2) carbon dioxide for photosyntesis;
(3) water for the transport of solids through the plant's
vascular system; and
(4) a broad arrangement of nutrients, which helps explain the diversity of the biosphere.
| Redrawn from Wikimedia Commons®
|
Fig. 1 Composition of gases
in the Earth's atmosphere through geologic time.
|
3. THE NEED FOR WATER
The most abundant single substance in the biosphere is water (H2O). The Earth's oceans, icecaps, glaciers, lakes, rivers, soils,
and atmosphere contain 1.5 billion
cubic kilometers of water in one
form or another. Water's unusual physical properties endow it
with a unique chemistry, which determines its biological
importance (Penman, 1970).
Water remains a liquid within the temperature range most suited for life processes,
In certain useful situations,
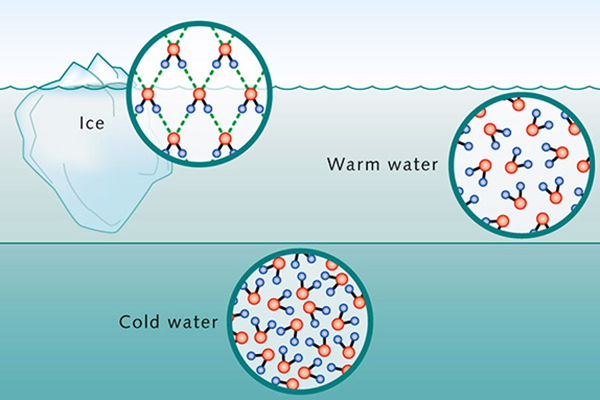
water remains in equilibrium with its solid and gaseous states, for instance, as ice on top of a lake.
Freezing starts at the surface of the lake and proceeds downwards.
This is because when subjected to cooling, water's shrinkage stops at 4°C.
From that point on, down to the freezing point, water expands, decreasing its density.
Therefore, the cooler water floats on top of the warmer water [Fig. 2 (a)].
Water has several other life-sustaining properties. The most important are
(Ponce, 2019):
Greatest specific heat among liquids, i.e.,
the amount of heat necessary to change the temperature of 1 kg of water by 1°C.
Highest heat of vaporization of any liquid and, hence, a very low volatility.
For a given energy input, the temperature of a given mass of water will rise more slowly than any other
material.
A small dipole moment, which measures
the electronegativity of water's molecular structure,
allowing water to dissolve almost any substance to some extent.
Greatest surface tension of
any liquid, so that the radius of curvature
of its meniscus will be greater than that of any other liquid. The greater the radius of curvature, the greater the water content.
Its dielectric constant
is greater than of any other substance, which makes water not chemically pure in its normal state. Liquid water is an ionic solution, always containing some
hydrogen ions. The concentration of hydrogen ions is expressed by the pH scale, varying between 0
and 14.
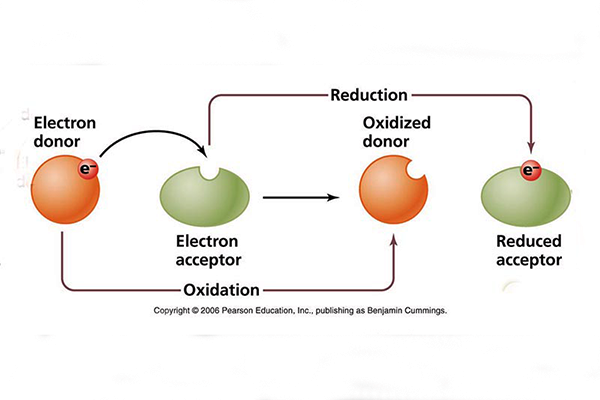
Varying redox potential, defined as
a measure of the affinity of a substance
to lose or gain
electrons and, thereby, to be oxidized or reduced, respectively [Fig. 2 (b)].
In oxidized environments, the redox potential may reach up to +800 mV, while in
extremely reduced environments it may reach as low
as -400 mV (Ponce, 2019).
Unlike any other substance in Nature, the varied physical properties of water enable
it to sustain life in the Earth's environments, including terrestrial, riverine, oceanic, and atmospheric.
|
[Click on top of figure to expand]
|
Fig. 2 (a) Water molecules and ambient temperature. |
|
|
[Click on top of figure to expand]
|
Fig. 2 (b) Processes of oxidation and reduction in water.
|
|
4. THE NEED FOR NUTRIENTS
Ecology defines the biosphere as the locus
of the interaction of hydrogen, carbon, nitrogen, and oxygen.
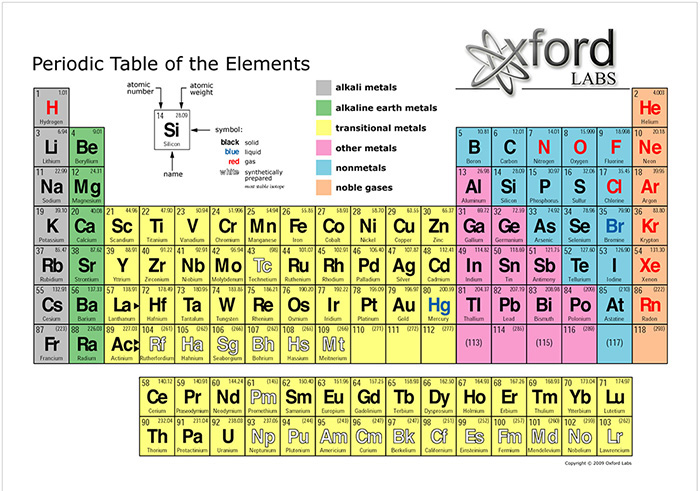
In the Periodic Table of the Elements,
these elements are numbered 1, 6, 7, and 8, respectively (Fig. 3).
If we enlarge this list to include
phosphorous (15) and sulphur (16),
we will have a set of six of the lightest sixteen elements,
which make up the acronym NCHOPS.
Taken together, these six elements
constitute about 99% by weight of the biosphere.
Many environmental problems arise from the exceptional reactivity of these six elements
(Deevey, 1970).
|
[Click on top of figure to expand]
|
Fig. 3 Periodic Table of the Elements. |
The biosphere
is mainly carbon dioxide (CO2) and water (H2O).
Nitrogen, a major constituent of protein, is surprisingly scarce, about 0.5%.
When they are ignited and burned, the constituents of biospheric ash amount to about 1.2% of the original weight.
Its dominant elements are calcium, potassium, silicon, and magnesium,
all with important
biochemical functions.
One atom of magnesium (0.099%) lies at the center of every
molecule of chlorophyll.
Silicon (0.122%) is useful for building hard structures.
Sulfur (0.071%) is the "stiffening" in protein. A protein cannot perform its function unless it is folded and shaped
in a particular way. This three-dimensional structure is maintained by bonds between sulfur atoms that
link one segment of a protein molecule to another.
Phosphorous (0.052%) is absolutely necessary for the biosphere.
The "high-energy phosphate bond" is the universal
fuel for all biochemical work within the cell.
One phosphorous atom per adenosine molecule is absolutely essential for the proper functioning of the biosphere
(Deevey, 1970).
Table 1, Part 1, shows the composition of the biosphere,
with the elements listed by increasing atomic number,
from 1 to 16. Part 2
shows the heavier elements (atomic weight greater than 16),
listed by their relative quantity. The three major elements,
oxygen, carbon, and hydrogen, constitute 98.4% (by weight) of the
biosphere. The remaining 1.6% are the nutrients. Leading the list is nitrogen, followed by calcium,
potassium, silicon, magnesium, sulfur, aluminum, phosphorous, chlorine, iron, manganese, and sodium. Table 2 orders the elements by weight (kg/ha).
|
TABLE 1. Composition of the biosphere, by elements (Part 1) (Deevey, 1970). |
Atomic number, in sequential order,
(1 to 16) |
Symbol |
Element |
Order, by weight |
Weight
(kg/ha) |
Fraction
of total |
Percentage of total |
| 1 |
H |
Hydrogen |
3 |
13,149 |
0.06591 |
6.591 |
| 2 |
He |
Helium |
0 |
0 |
0 |
0 |
| 3 |
Li |
Lithium |
0 |
0 |
0 |
0 |
| 4 |
Be |
Berilium |
0 |
0 |
0 |
0 |
| 5 |
B |
Boron |
0 |
0 |
0 |
0 |
| 6 |
C |
Carbon |
2 |
78,502 |
0.39346 |
39.346 |
| 7 |
N |
Nitrogen |
4 |
1,001 |
0.00503 |
0.503 |
| 8 |
O |
Oxygen |
1 |
104,605 |
0.52420 |
52.420 |
| 9 |
F |
Fluorine |
0 |
0 |
0 |
0 |
| 10 |
Ne |
Neon |
0 |
0 |
0 |
0 |
| 11 |
Na |
Sodium |
15 |
38 |
0.00020 |
0.020 |
| 12 |
Mg |
Magnesium |
8 |
196 |
0.00099 |
0.099 |
| 13 |
Al |
Aluminum |
10 |
111 |
0.00057 |
0.057 |
| 14 |
Si |
Silicon |
7 |
241 |
0.00122 |
0.122 |
| 15 |
P |
Phosphorous |
11 |
104 |
0.00052 |
0.052 |
| 16 |
S |
Sulphur |
9 |
142 |
0.00071 |
0.071 |
| Part 2: These elements, of atomic number
greater than 16, are ordered by unit weight (kg/ha). |
| Atomic number |
Symbol |
Element |
Indicated order, by weight |
Weight
(kg/ha) |
Fraction
of total |
Percentage of total |
| 20 |
Ca |
Calcium |
5 |
754 |
0.00379 |
0.379 |
| 19 |
K |
Potassium |
6 |
456 |
0.00229 |
0.229 |
| 17 |
Cl |
Chlorine |
12 |
99 |
0.00050 |
0.050 |
| 26 |
Fe |
Iron |
13 |
77 |
0.00040 |
0.040 |
| 25 |
Mn |
Manganese |
14 |
42 |
0.00021 |
0.021 |
|
| Sum |
- |
- |
- |
199,517 |
1.0000 |
100.000 |
.
|
TABLE 2. Composition of the biosphere, by unit weight (kg/ha) (Deevey, 1970). |
| Atomic number |
Symbol |
Element |
Order, by weight |
Weight
(kg/ha) |
Fraction
of total |
Percentage of total |
| 8 |
O |
Oxygen |
1 |
104,605 |
0.52420 |
52.420 |
| 6 |
C |
Carbon |
2 |
78,502 |
0.39346 |
39.346 |
| 1 |
H |
Hydrogen |
3 |
13,149 |
0.06591 |
6.591 |
| 7 |
N |
Nitrogen |
4 |
1,001 |
0.00503 |
0.503 |
| 20 |
Ca |
Calcium |
5 |
754 |
0.00379 |
0.379 |
| 19 |
K |
Potassium |
6 |
456 |
0.00229 |
0.229 |
| 14 |
Si |
Silicon |
7 |
241 |
0.00122 |
0.122 |
| 12 |
Mg |
Magnesium |
8 |
196 |
0.00099 |
0.099 |
| 16 |
S |
Sulphur |
9 |
142 |
0.00071 |
0.071 |
| 13 |
Al |
Aluminum |
10 |
111 |
0.00057 |
0.057 |
| 15 |
P |
Phosphorous |
11 |
104 |
0.00052 |
0.052 |
| 17 |
Cl |
Chlorine |
12 |
99 |
0.00050 |
0.050 |
| 26 |
Fe |
Iron |
13 |
77 |
0.00040 |
0.040 |
| 25 |
Mn |
Manganese |
14 |
42 |
0.00021 |
0.021 |
| 11 |
Na |
Sodium |
15 |
38 |
0.00020 |
0.020 |
| Sum |
- |
- |
- |
199,517 |
1.0000 |
100.000 |
.
We observe that the biosphere is both wet and carbonaceous. A single class of compounds, formaldehyde (CH2O) and its polymers,
makes up more than 98% of the total weight.
Deevey (1970)
concludes his seminal work on the
mineral cycles of the Earth by recapping the empirical formula for living matter:
H2960O1480C1480N16P1.8S.
In summary, we draw the following conclusions regarding the composition of the biosphere:
(1) the overwhelming presence of formaldehyde (CH2O), constituting about 98.4% by weight;
and (2) the presence of a gamut of nutrients, twelve (12) of them, listed in Table 2;
all light elements, mostly with atomic weight below 17 but certainly below 27.
Other nutrients, most likely present in
micronutrient and trace amounts in alternative samples,
were not documented in Deevey's work.
These include (atomic weights indicated in parenthesis): chromium (24),
cobalt (27), nickel (28), copper (29), zinc (30), selenium (34), and molybdenum (42).
5. CLIMATE AND THE HUMAN RACE
On November 15, 2022, the world's population reached
8 billion.
The human race is spread across the world's continents and climates
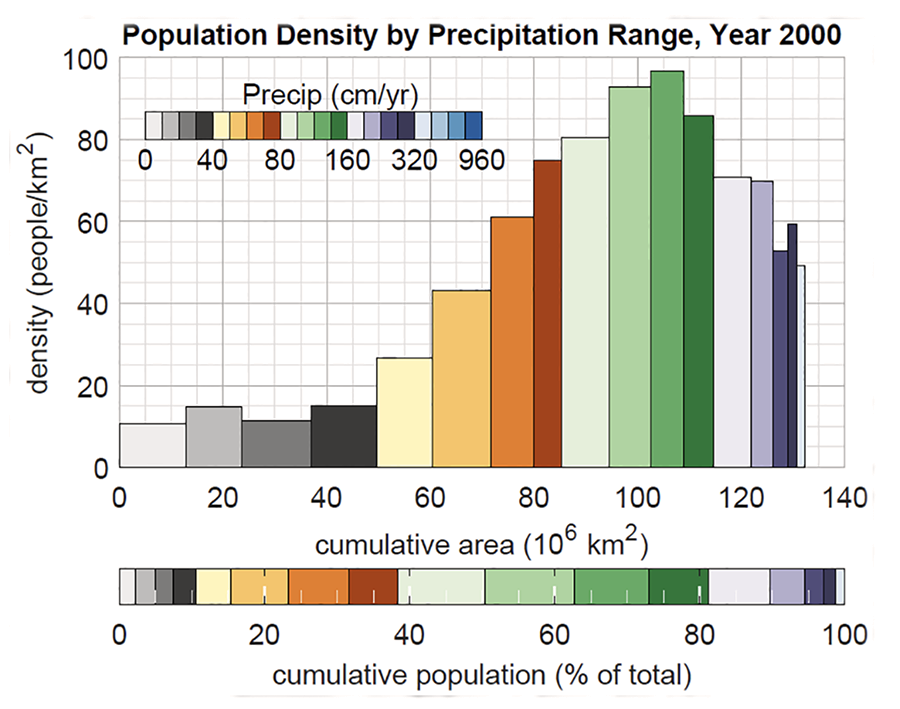
(Fig. 4) (Klinger and Ryan, 2022). Table 3 shows that 62% of the world's
population live in
humid regions, with mean annual precipitation more than 800 mm;
the remainder, 38%, live in arid regions, with less than 800 mm.
It also shows that 70% of the population (27% semiarid + 43% subhumid)
live within the 400 and 1,600 mm isohyets
(the data shown in Table 3 has been taken from Fig. 4).
We conclude that humans, by and large, have a slight preference for humid regions:
About six out of ten persons live in humid regions.
|
[Click on top of figure to expand]
|
Fig. 4 World population density by precipitation range (Year 2000). |
|
TABLE 3. World population by precipitation range (Year 2000) (Klinger and Ryan, 2022). |
| Climate |
Precipitation (mm/yr) |
Population in range (%) |
Cumulative population (%) |
Division of population (%) |
| Superarid |
Less than 100 |
2 |
2 |
Arid: 38 |
| Hyperarid |
100-200 |
3 |
5 |
| Arid |
200-400 |
6 |
11 |
| Semiarid |
400-800 |
27 |
38 |
| Subhumid |
800-1,600 |
43 |
81 |
Humid: 62 |
| Humid |
1,600-3,200 |
18 |
99 |
| Hyperhumid |
3,200-6,400 |
1 |
100 |
| Superhumid |
More than 6,400 |
0 |
100 |
The above rationale relates to the amount of environmental moisture.
It is a correct assessment of the climate niche reality, at least as far as the amount of water is concerned.
However, it does not consider the underlying soils.
Soils in arid regions have generally not been leached by large amounts of
precipitation and associated surface/subsurface flow; therefore, they have remained
unscathed by time, retaining the majority, if not all, of their nutrients.
We note that both water and nutrients are necessary for the proper functioning of the biosphere.
The biosphere needs both water in specific quantities (Section 3) and nutrients of different kinds (Section 4).
Relying too much on either one of them, to the detriment of the other,
would be counterproductive. What is
the happy medium, one that will
provide enough water for the plants' needs, coupled with
a sufficient amount of nutrients
that will enable them, together, to fulfill the avowed purpose of the biosphere?
6. THE 800-MM ISOHYET
An isohyet is a curve that shows "equal precipitation" in units of depth,
usually in milimeters or inches.
In surface-water hydrology, the isohyet curve, or simply "isohyet",
is normally used to depict mean annual precipitation in mm/year.
The 800-mm isohyet is the threshold between arid and humid climates.
More precisely, it is the limit between a semiarid region, in the range 400-800 mm,
and a subhumid one, in the range 800-1,600 mm (Ponce and others, 2000).
The source of the 800-mm value merits further elaboration.
The amount of moisture stored in the atmosphere is a function of latitude and climate,
varying typically from 2-15 mm in polar and arid regions to 45-50 mm in humid regions
(UNESCO, 1978). A mean global terrestrial value
of 25 mm is assumed. The atmospheric moisture
recycles every eleven (11) days on the average, for a total of 365 / 11 ≅ 33 cycles per year (L'vovich, 1979). This results in a value of
mean annual global terrestrial precipitation
of Pagt = 25 × 33 = 825 mm. Here, we assume the nearest hundred:
Pagt = 800 mm.
The value of 800 mm is the fulcrum separating arid from humid
climates, particularly when defined only in terms of mean annual precipitation, a definition
intended to best characterize subtropical and mid-latitudinal regions.
Arid regions have generally less water and moisture and, therefore, feature relatively unleached soils.
The more arid the region, the more nutrients, in both quantity and quality,
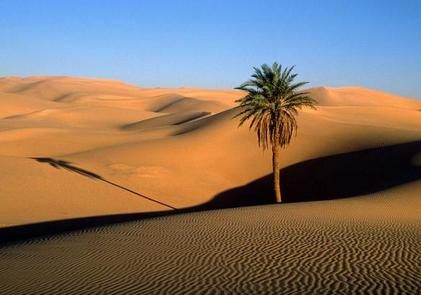
are likely to remain in the soil profile [Fig. 5 (a)].
Conversely, humid regions have more water and moisture, with substantial soil leaching having
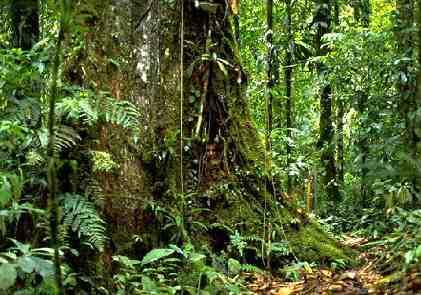
taken place in geologic time. The more humid the region, the more likely it is that the soils are devoid
of nutrients [Fig. 5 (b)]. This fact has been widely recognized
(Ponce, 2023).
Fig. 5 (a) The Sahara desert.
|
|
Fig. 5 (b) The Amazon rainforest.
|
|
We posit that humanity is faced with a perplexing dilemma: The more arid the region, the less water there is;
the more humid the region, the fewer nutrients there are. Adequate quantities of
both water and nutrients are needed for the proper functioning
of the biosphere. It is surmised here that the availability
of both resources
may be optimal at or near the 800-mm isohyet.
A region that is drier than the optimum (say, less than 400 mm)
will have a good supply of nutrients of all kinds, including the nutrients that are much needed by vegetation
(among them, potassium and magnesium), and those that may not be needed in the amounts
in which they are present (sodium and calcium).
Therefore, the latter will have to be wasted, creating a problem of waste
salt disposal which, more often than not, turns out to be prohibitively expensive.
[As has been shown in several documented cases,
societies around the world have yet to pay for the proper disposal of irrigation waste salt
(Ponce, 2023)].
Conversely, a region that is wetter than the optimum (say, greater than 1,600 mm)
will have a guaranteed supply of water, but the nutrients
may be lacking in quantity and quality,
a situation which is clearly not well suited for
the productivity of agriculture.
We conclude that a region at or close to the 800-mm isohyet is one
where the supply of both water and nutrients
is optimal; therefore, it is a region best suited to
the well-being of the human species. To allow for some latitude,
a range of 400-1,600 mm
of mean annual precipitation may be considered reasonable.
The previous statements do not mean to imply that regions outside
of the range (400-1,600 mm) are to be avoided.
Rather, it implies that the settlement of arid and humid regions outside of this range
will turn out to be more expensive, very likely in hitherto unforeseen ways, which may result
in additional tangible costs and/or other subliminal negative effects to public and environmental health.
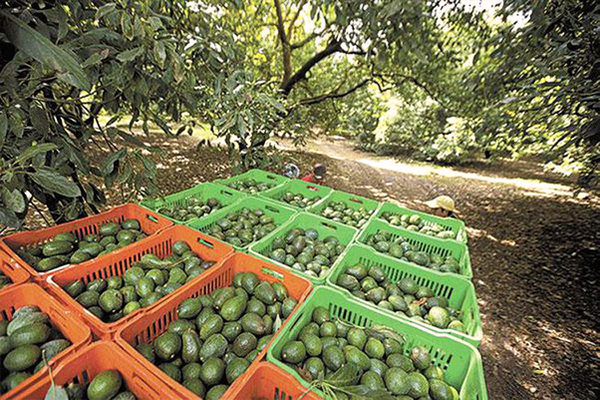
Case study: Michoacan, Mexico. Mexico is the largest avocado producer in the world,
accounting for 30% of global production (U.S. Department of Agriculture, 2021).
The state of Michoacan, in central western Mexico, accounts for 75% of the national avocado production
and 81% of the total production value. Not surprisingly, mean
annual precipitation in Michoacan is 850 mm (INEGI, 2023),
which is very close to the value of 800 mm regarded as optimal in this article.
|
[Click on top of figure to expand]
|
|
Elías González (quora.com) |
Fig. 6 Avocado growing in Michoacan, Mexico. |
7. OUTLOOK
We have shown that both water and nutrients are
necessary for the proper functioning of the biosphere. The world's climates may be broadly classified
into: (1) arid, and (2) humid; arid for mean annual precipitation less than 800 mm; humid
for greater than 800 mm. Six out of ten people live in humid regions, revealing humans' slight
preference for humid environments. Arid regions lack water; humid regions lack nutrients.
We note that the 800-mm isohyet, the threshold between arid and humid regions, may
possess an optimal combination of water and nutrients: (1) plenty of water to satisfy the demands of
vegetation, and (2) a healthy array of nutrients, in both quantity and quality, to fulfill the needs
of the ecosystem.
To close, life near the 800-mm isohyet may prove to be generally healthier for humans,
and definitely more sustainable.
The quantity of flying insects and other annoying pests will be reduced, while virtually eliminating
the need for the disposal of additional waste salt. The latter may be created due to the
perceived need for the irrigation of arid lands to satisfy societal demands for additional food and fiber.
REFERENCES
Deevey, E. S. Mineral Cycles.
Scientific American, Vol. 223, No. 3, September, 149-158.
Hutchinson, G. E. The Biosphere.
Scientific American, Vol. 223, No. 3, September, 45-53.
INEGI, 2023.
Cuéntame,
Monografías, Información, Michoacán. (Consulted
on September 20, 2023).
Klinger, B. A., and S. J. Ryan. 2022. Population distribution within the human climate niche.
PLOS Climate, 1(11).
L'vovich, M. I. 1979. World water resources and their future.
American Geophysical Union, Washington, D.C.
Penman, H. L. The Water Cycle.
Scientific American, Vol. 223, No. 3, September, 99-108.
Ponce, V. M., R. P. Pandey, and S. Ercan. 2000.
Characterization of drought across climatic spectrum.
Journal of Hydrologic Engineering, ASCE, Vol. 5, No. 2, April, 222-224.
Ponce, V. M. 2019.
The properties of water.
Online article. https://ponce.sdsu.edu/properties_of_water.html
Ponce, V. M. 2023.
Is the irrigation of arid lands a double-edged sword?.
Online article.
https://ponce.sdsu.edu/irrigation_double_edged.html
UNESCO. 1978. World Water Balance and Water Resources of the Earth. Paris, France.
U.S. Departament of Agriculture, 2021.
Global Agriculture Information Network Report, October 5, 2021.
|
