|
|
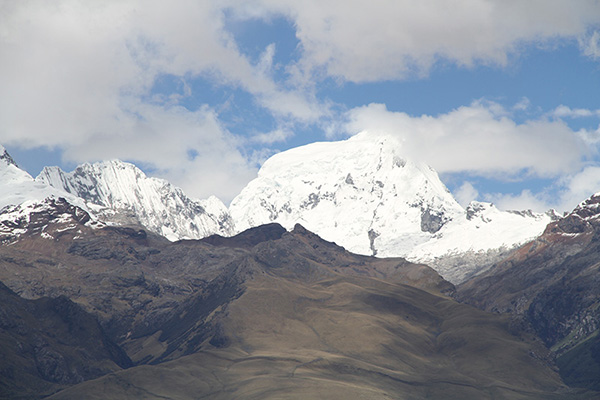
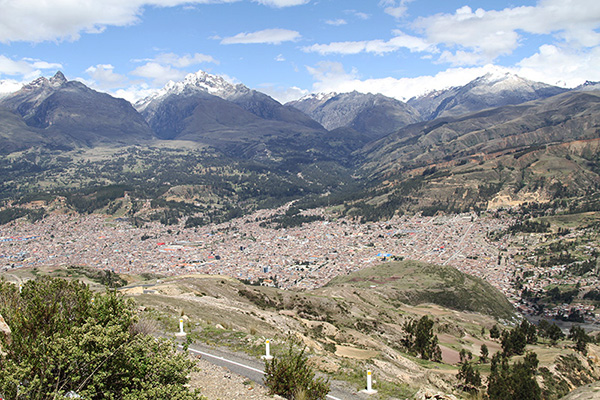
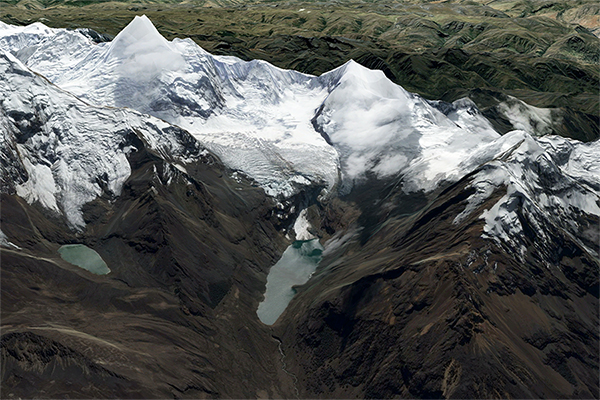
Closeup of the White Range near Huaraz, Ancash, Peru. |
EFFECT OF GLOBAL CLIMATE CHANGE
ON THE WHITE RANGE OF PERU
Víctor M. Ponce
150710
|
|
Abstract.
Global climate change
threatens to upset the delicate balance of Nature.
The sustained warming of the past 50 years has produced a host of negative effects. In this paper we
highlight the effect that global warming has had on the tropical glaciers,
including melting, recession,
and their possible eventual disappearance.
We specifically focus on the White Range of Peru, a resource of global importance and
significant natural and aesthetic value.
Global average surface temperatures have increased
about 0.6°C in the past 50 years.
The rise in temperatures has
negatively affected the tropical glaciers,
causing a decrease in total volume and aerial coverage.
Glacier melting
has caused an increase in the number of glacial lakes in the White Range.
Continuing glacier melting poses a significant threat
of recurring glacial lake outburst floods (GLOF).
Relevant scientific understanding, coupled with enlightened
interdisciplinary management, is necessary for the national government of Peru and its partners in the
international community to develop an effective
strategy to
cope with these threats. Sustainability being out of the question, the aim
remains to mitigate/reduce
the effects of global warming within the next one to two generations.
|
1. GLOBAL CLIMATE CHANGE
|
Global climate change refers to the accelerated warming of the world's climate over the past 50 to 60 years,
attributable to the
burning of fossil fuels. Since the dawn of the industrial age, developed human societies have been burning coal, natural gas, and
petroleum, ostensibly to power industry, urban development, and transportation. The excessive pumping of carbon dioxide into the atmosphere
is threatening to upset the delicate balance of Nature.
More carbon is now entering the atmosphere that can be removed
through photosynthesis and other natural means.
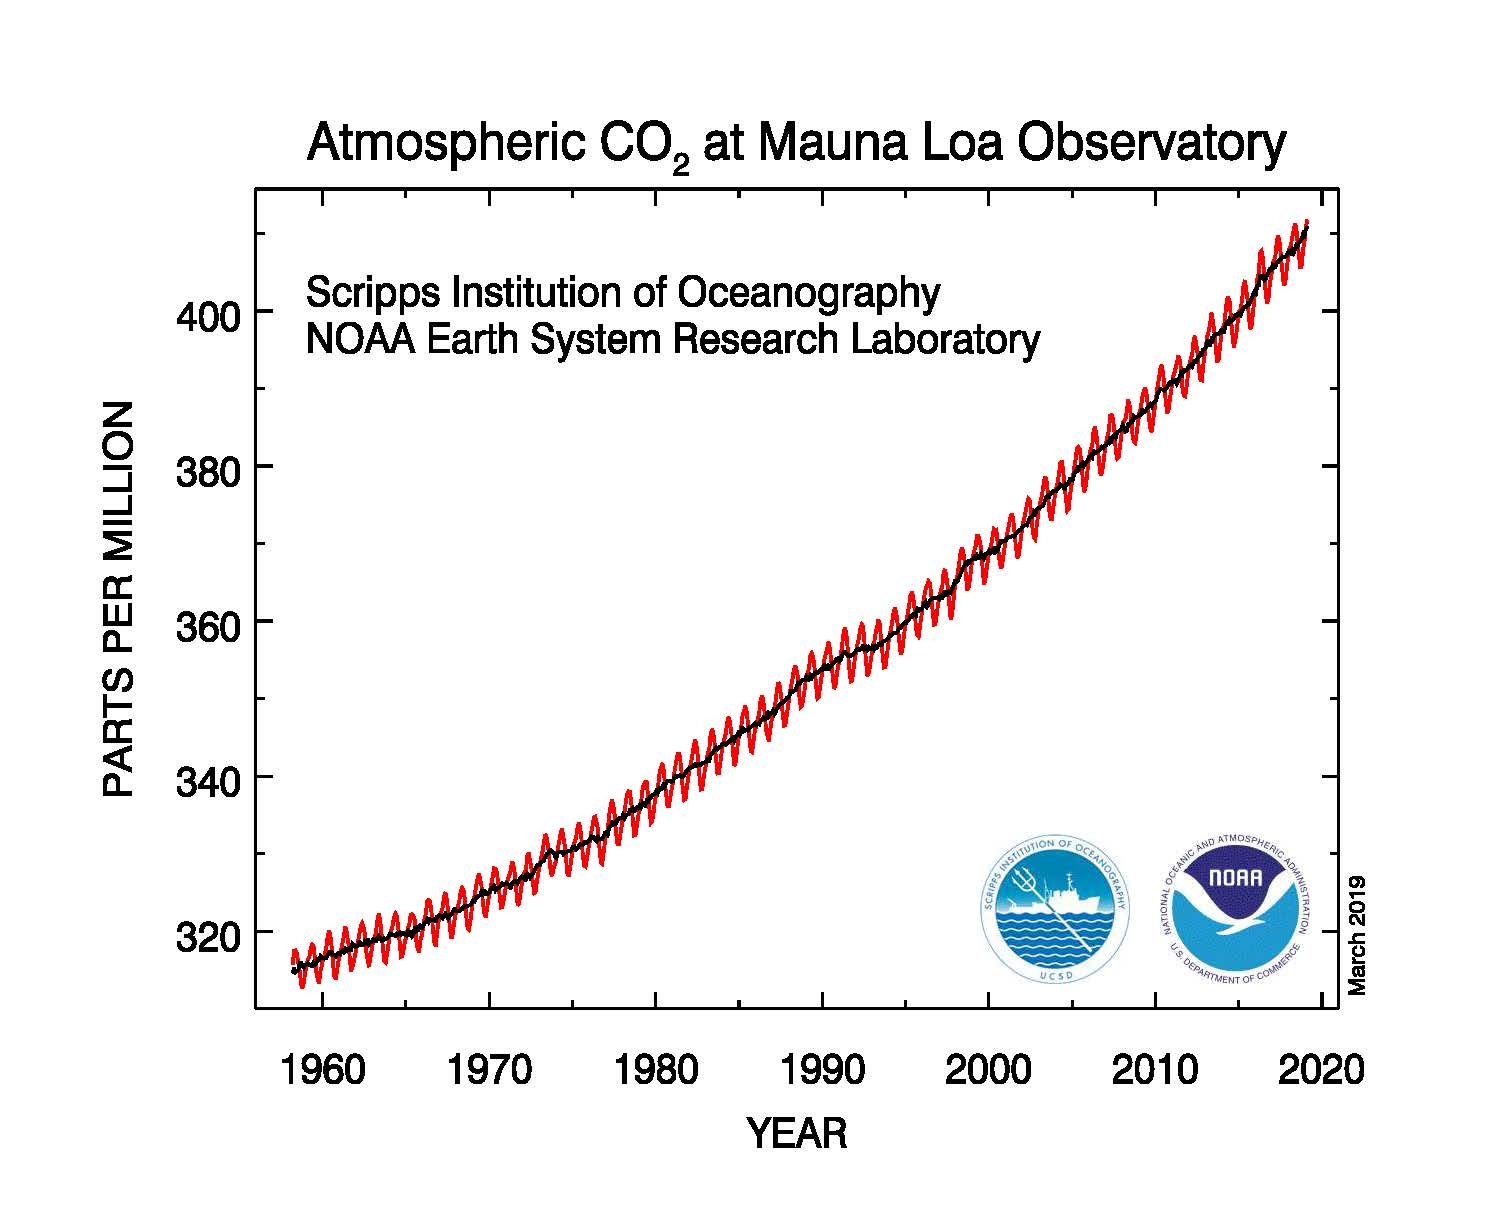
The most widely recognized indicator of global climate change is the atmospheric concentration of carbon dioxide (CO2)
measured at the Mauna Loa Observatory, in Hawaii. Figure 1 shows the complete record to date, which spans the period from March 1958 to March 2019.
The red curve shows the seasonal variations (the data corresponds to the
Northern Hemisphere), while the black curve shows the average annual trend.
This curve is referred to as the Keeling curve, in honor
of Charles David Keeling, who started the record (Ponce, 2011).
| NOAA Earth System Research Laboratory |
|
Fig. 1 Atmospheric concentration of carbon dioxide at Mauna Loa, Hawaii.
|
2. GLOBAL WARMING
It is clear from the record that the concentration of carbon dioxide,
which was around 318 ppm in 1958, has now [March 2019] reached
the value of
410 ppm, all-the-while showing a definitely upward trend (Fig. 1). These numbers show that the concentration of carbon dioxide
has increased about 29% in the past 63 years of record. Most scientists
believe that the rise in the Keeling curve is due to
the excessive burning of fossil fuels, which,
once in the atmosphere, tend to accumulate, since there is no natural way of returning to the Earth (in the quantities in which it is being burned).
In effect, the atmosphere is seen to be acting as a convenient dump for the excess carbon.
How does the atmospheric concentration of carbon dioxide affect global climate change?
In other words: How does an increase in
atmospheric CO2 produce global warming? To answer this question, we need to look at the constituents of the atmosphere:
(a) nitrogen (78%), (b) oxygen (21%),
(c) water vapor (0.4%), (d) carbon dioxide (0.041%, i.e., 410 ppm), and (e) smaller percentages of other gases.
While the constituents of the atmosphere are subject
to change in geologic time, they tend to be essentially constant when viewed
in the timescale of human interest, say 100 years.
The exception is carbon dioxide, which has increased about 29% in the past 63 years (Fig. 1).
In 1896, Svante Arrhenius published a paper
entitled
"On the influence of carbonic acid in the air upon
the temperature of the ground," where he
pionereed the science of global warming (Arrhenius, 1896).
He reasoned that the air retains heat in two ways:
By diffusion as the heat passes through the air, and
By selective absorption, since some atmospheric constituents absorb great quantities of heat.
Nitrogen (N2) and oxygen (O2), the atmosphere's primary constituents,
are homonuclear diatomic molecules, too tightly bound together to be able to absorb heat through vibration.
The selective absorption of heat is accomplished by carbon dioxide (CO2)
and water vapor (H2O), two non-diatomic molecules
which are present in the air in small quantities.
These two molecules consist of two elements and more than two atoms,
bound together loosely enough to be able to vibrate somewhat with the absorption of
infrared radiation (i.e., the heat coming from the ground) (Fig. 2).
Eventually, the vibrating molecule will emit the radiation
again and it will likely be absorbed by yet another molecule.
This absorption-emission-absorption cycle serves to keep
part of the heat near the Earth's surface, insulating the latter from the cold of outer space.
Other heat-absorbing non-diatomic compounds such as
methane (CH4)
and nitrous
oxide (N2O) are also present in the atmosphere,
albeit at much smaller concentrations.
| University
Corporation for Atmospheric Research |
Fig. 2 Heat
absorption of carbon dioxide molecule through vibration.
|
Of the two more important non-diatomic constituents of the atmosphere, water vapor
(H2O) and carbon dioxide (CO2),
only the later has a clear anthropogenic origin.
Water vapor varies in the atmosphere in largely unpredictable ways, with no discernible human
influence in the timescale of analysis (the past 60 years).
The selective absorption of heat through vibration by the non-diatomic components of the
atmosphere effectively means that these serve as a blanket to retain heat
near the Earth's ground surface, impeding its diffusion into stellar space.
Their concentration is an indication of the thickness of the blanket;
thus, a carbon dioxide concentration of 410 ppm ought to be about 29% more effective in
retaining heat than a concentration of 318 ppm.
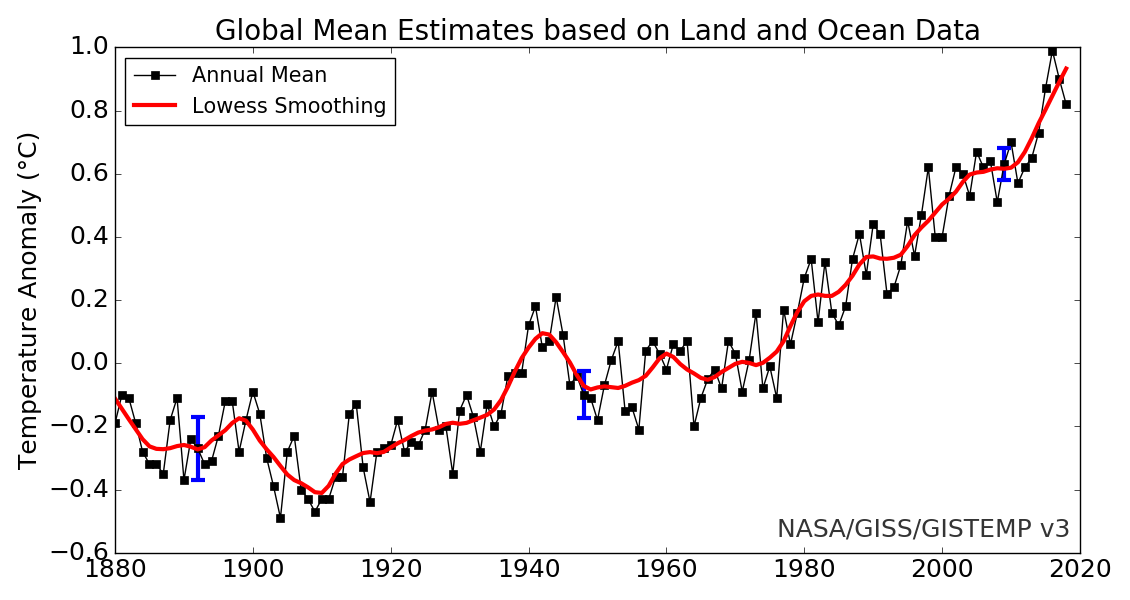
That this is indeed the case is demonstrated by the record of global
land-ocean temperatures shown in Fig. 3.
This figure shows global surface temperature anomalies
(black squares) and their 5-year running means (red curve),
using a base period of 1950 to 1980.
The data indicates that global surface temperatures have increased about 0.6°C since 1960.
|
NASA Goodard Institute for Space Studies |
Fig. 3 Global land-ocean temperature index.
Thus, there is very good reason to believe that Fig. 2 is the cause and
Fig. 3 the effect, and that
the Earth's surface air temperatures are increasing.
Since the burning of fossil fuels
is the only process that can pump carbon dioxide
to the atmosphere in such great quantities,
it is readily seen how this activity,
which has taken place in earnest in the past 50 years,
may be regarded as the culprit.
The effect that protracted global warming will have on the global
hydrologic cycle, on the
regional weather and climate,
and on the world's icecaps and glaciers is now beginning to be examined. In this paper, we focus on the
White Range of Peru, which features the largest concentration of glaciers in the
tropics. It is clear that global warming is bound to significantly affect these glaciers.
3. THE WHITE RANGE OF PERU
|
The White Range of Peru
is located between 8°23' and 10°02' South Latitude,
encompassing 122 mountain peaks,
with elevations above 5,000 m, of which 15 of them lie above 6,000 m. (Data Bank on Glaciers, 2015).
In 1970, the aerial extent of the glaciers was measured at 723 km2,
which comprised
26% of the area covered by all tropical glaciers (in Peru, Bolivia, Ecuador, Colombia, Venezuela, Africa, and
Indonesia) (Ames and Francou, 1995).
There are 755 glaciers in the White Range [2015] (Nelson Santillan, personal communication). As it is usual in the tropics, these glaciers are small in areal extent,
averaging 1 km2, with only 12 of them exceeding 5 km2.
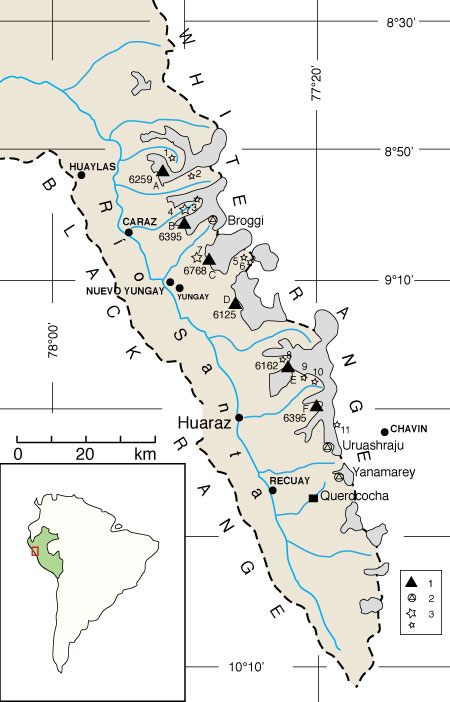
Figure 4 shows the salient geographical features of the White Range.
This figure shows: (a) the outline of the basin of the Rio Santa (Santa River),
(b) the location of the snow-capped White Range along the eastern boundary,
and (c) the snow-free Black Range along the western boundary.
The following are noted :
Principal mountain peaks above 6,000 m elevation: Table 1 (a);
Cities in the vicinity;
Meteorological station at Querococha;
Glaciers
Broggi, Uruashraju, and Yanamarey; and
Lakes with risk of avalanche: Table 1 (b).
|
|
Modified from Ames and Francou |
Fig. 4 Salient geographical features of the White Range of Peru.
Table 1 (a). Peaks above
6,000 m elevation.1
|
| Label |
Name |
Elev. (m) |
| A |
Santa Cruz |
6,259 |
| B |
Huandoy |
6,395 |
| C |
Huascaran |
6,768 |
| D |
Hualcan |
6,125 |
| E |
Ranrapalca |
6,162 |
| F |
Huantsan |
6,395 |
| 1 Source: Ames and Francou, 1995, op. cit..
|
|
| |
Table 1 (b). Lakes with risk of avalanche. 1
|
| No. |
Name |
| 1 |
Safuna |
| 2 |
Arhuaycocha |
| 3 |
Milluacocha |
| 4 |
Palcacocha |
| 5 |
Tullparaju |
| 1 Source: Nelson Santillán Portilla,
Autoridad Nacional del Agua, Lima, Perú.
|
|
|
|
4. EFFECTS OF GLOBAL CLIMATE CHANGE
The effects of global climate change on the health of tropical glaciers is predictable.
There is and will continue to be glacier melt, which, depending on the extent of the recession,
may partially or totally compromise
glacier integrity. The glaciers of the White Range are large compared to other glaciers of the tropics
and, therefore, are likely to last longer. Smaller glaciers in Venezuela, Colombia, and Ecuador
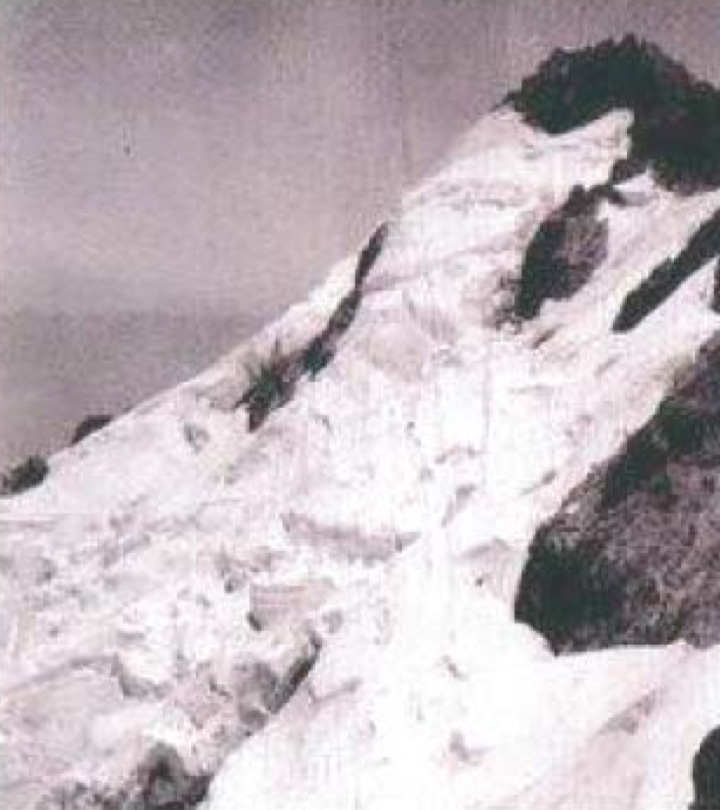
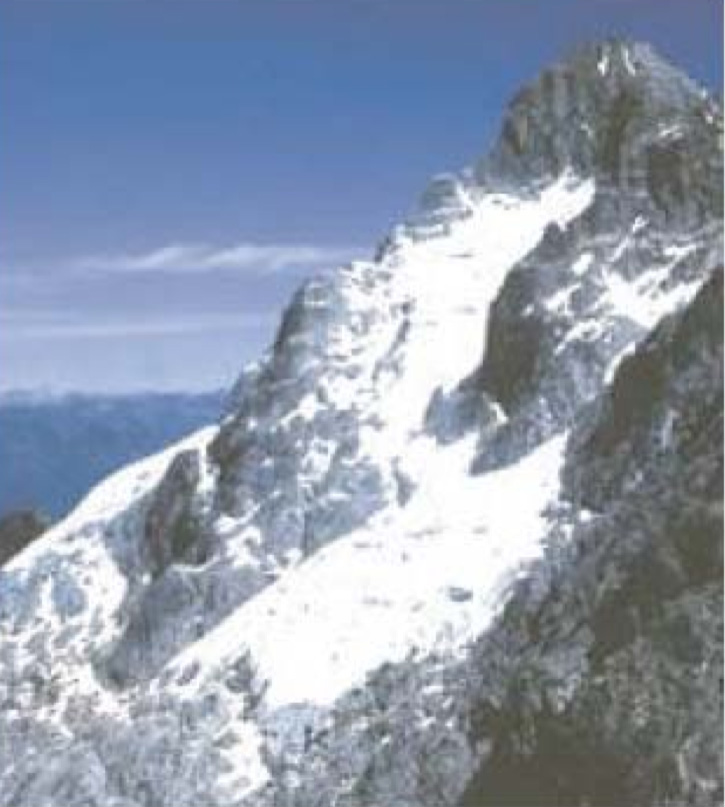
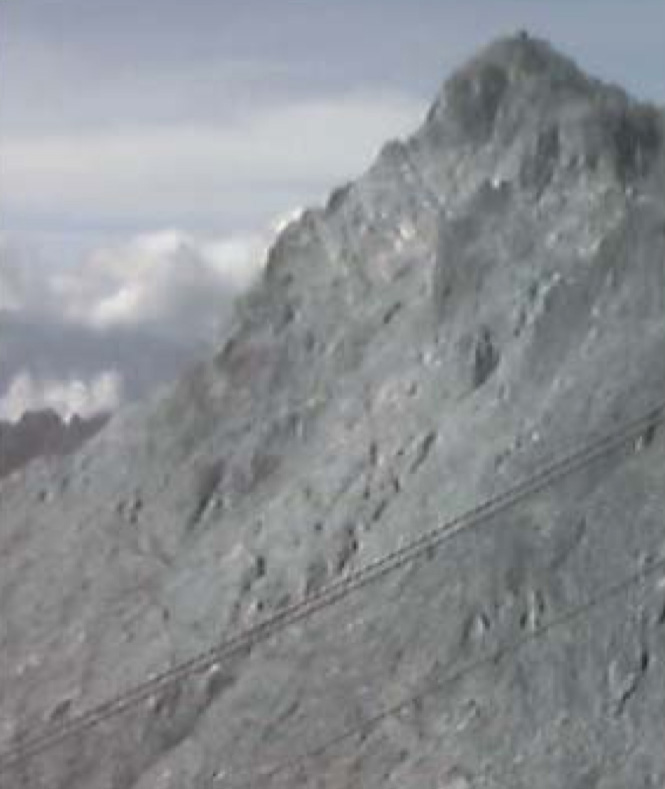
are either in frank recession or have already disappeared completely (Fig. 5) (Vuille, 2013).
|
|
Fig. 5 Timed sequence of the Espejo Glacier,
at Pico Bolivar, Venezuela, showing the progressive
melting
[Photos courtesy of Eduardo Carillo, as cited by Vuille (2013)].
|
Glacier recession.
The effects of global climate change on the White Range of Peru have been documented
since the late 1960s. Ames and Francou (1995) report on measurements on the Broggi,
Uruashraju, and Yanamarey glaciers shown in Table 2,
pointing to increasing recession rates
since 1982 (see Fig. 4 for the precise geographical locations of these glaciers).
Moreover, recent studies of the Yanamarey glacier
have shown that the
average recession rate in the
six-year period from 2003 to 2009 has exceeded 30 m/yr (Bury et al., 2010).
Based on current recession rates, Bury et al.
(op. cit.)
have projected that the Yanamarey glacier
will disappear within 50 years (Fig. 6).
Table 2. Measured recession rates of three White Range glaciers.
|
| Period |
Recession rate (m/yr)
|
| Broggi |
Uruashraju |
Yanamarey |
| 1932-48 |
18.1 |
- |
- |
| 1949-81 |
11.0 |
8.0 |
6.0 |
| 1982-93 |
30.0 |
19.6 |
18.6 |
|
|
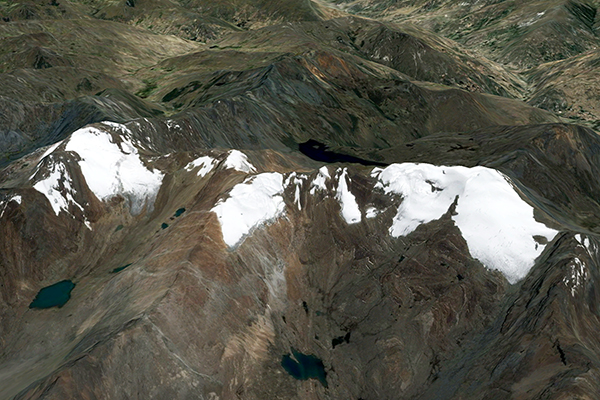
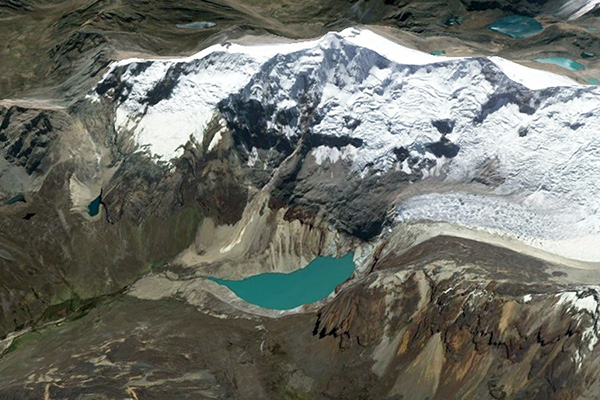
Fig. 6 (a)
Aerial perspective of the Yanamarey glacier, pointing towards the northeast [2015].
|
|
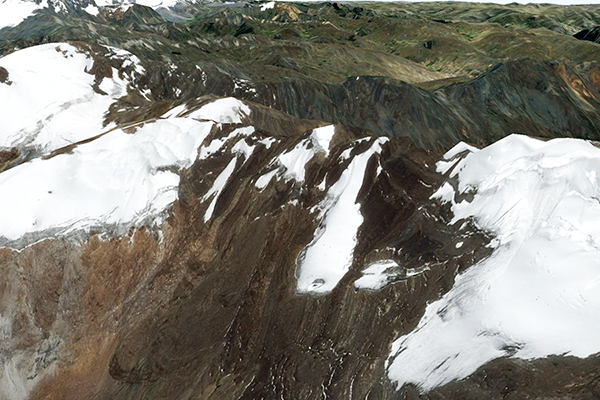
Fig. 6 (b)
Closeup of the Yanamarey glacier, showing most recent melt [2015].
|
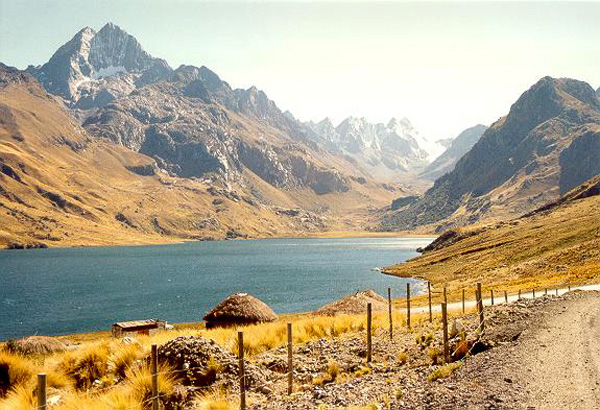
Figure 7 shows Lake Querococha, located west and downstream of the Yanamarey glacier,
with the glacier visible in the background (see Fig. 4 for a precise location
of Lake Querococha).
This figure, taken in 2003, shows that at that time
the glacier may have been much greater; compare with Fig. 6 (a).
|
Fig. 7 Lake Querococha, with the Yanamarey glacier
visible in the background
(photo taken in August 2003).
|
Several studies have sought to estimate the extent of glacier recession in the
White Range. Using remote sensing, Racoviteanu et al. (2008) found that the total glacier surface
decreased by 22.4% between the years 1970 and 2003, amounting to an average rate of 0.68% yr-1.
In contrast,
Baraer et al. (2012) have documented
recession rates of 0.62% yr-1 for the much longer period of 1930-2009.
Significantly, for the period 1990-2009, the Baraer et. al. data (op. cit.) indicated a
rate of 0.81% yr-1, pointing to an acceleration of the recession rate in recent times.
Moreover, a recent study
has shown that the loss of glacier surface in the White Range between the period 1970-2003 has been 27% (Autoridad Nacional del Agua, 2014).
Related effects.
The effects of global climate change on the White Range (and other
glaciers of the tropical zone) are not limited to glacier recession.
The effects encompass a gamut of related changes in different fields,
including: (a) climatology, (b) geomorphology,
(c) hydrology,
(d) ecology, and (e) socioeconomics.
These changes are described in Table 3.
|
Table 3. Effects of global climate change on the White Range and vicinity.
|
| Field |
Effect
| Description
|
| Climatology |
Temperature increase |
Temperatures
have risen substantially in the past 50 years. |
Glacier recession |
Glaciers have
receded substantially in the past three to five decades. |
| Geomorphology |
Formation of lakes |
The number of glacial lakes
in the vicinity
has increased substantially (more than 70% in the past 50 years). |
Glacial lake outburst |
Glacial
lake outburst floods remain a threat to life and property in the
downstream valleys. |
| Hydrology |
Seasonal |
In the short term, changes in seasonal runoff are taking place
as the additional melt increases the baseflow. |
Annual |
In
the medium term, increased surface runoff is taking place
as the additional melt reaches the stream network. |
Pluriannual |
In the long term, reductions in surface runoff are bound to take place,
as basin moisture is no longer being
stored as snow and ice, to be gradually released as snowmelt. |
| Ecology |
On life zones |
At least ten biological life zones
have been identified, which will tend to shift. |
On floral species |
More than 50 groundcover
and 18 woody and herbaceous species that have been identified will be affected. |
On faunal species |
More than 70 animal species
will be affected. |
| Socioeconomics |
On human settlement |
The people living in the
Callejon de Huaylas and vicinity will be directly affected. |
|
The changes in the White Range are currently occurring and are expected to continue well into the future.
Glacier coverage has declined by
more than 25% since 1970; furthermore, between 1951 and 1999, average temperature has increased
0.35°-0.39° per decade, significantly at an
accelerating pace (Bury et al., 2010).
New glacial lakes.
Glacial lakes develop as a direct result of the conjunction
of glacial melt with moraine (glacial till) geomorphology.
Large glacial lakes, particularly those with more than 5 million cubic meters of water, pose significant risks for local residents and infrastructure,
in view of the scale of the destruction that would ensue from an outburst flood.
In 1953, a comprehensive glacial lake inventory revealed the existence of 223 lakes
in the White Range. Thirty-five (35) of the 223 lakes were classified as unstable,
with twenty-three (23) of them requiring immediate attention
(Carey, 2010).
With protracted global climate change and the rise in average temperature,
the number of glacial lakes in the White Range has continued to increase.
In 1962, a second inventory resulted in a total of
263 lakes; by 1997, the number of lakes had increased to 374.
Presently, the number of glacial lakes in the White Range is more than 800 (Table 4).
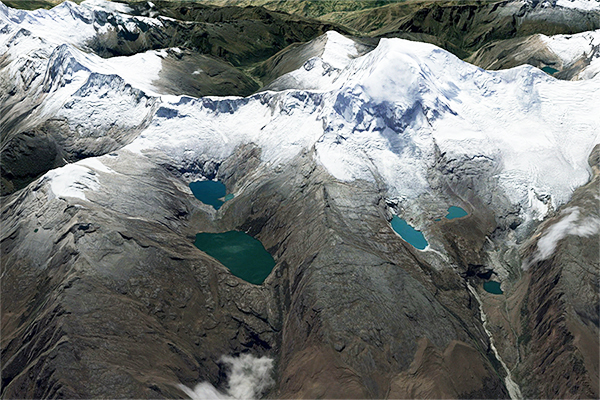
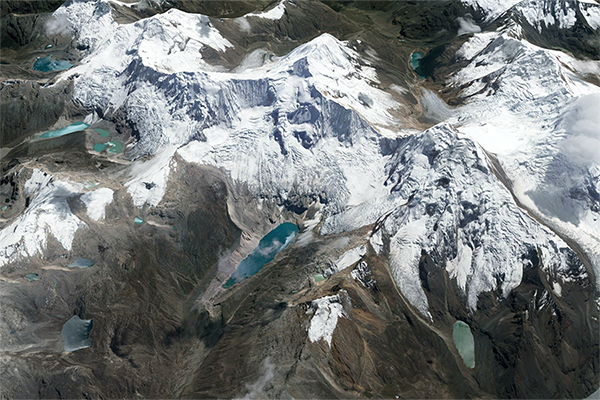
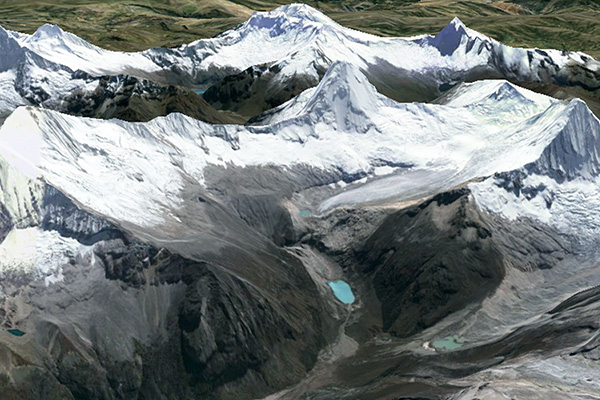
Figure 8 shows the Nevado Hualcán, near Carhuaz,
a typical example of a glacier featuring many glacial lakes.
Table 4. Increase in the number of glacial lakes
in the White Range.
|
| Year |
No. of
lakes
1 |
Increase in the number of lakes within the indicated period |
Annual rate of increase in the number of lakes |
| 1953 |
223 |
- |
- |
| 1962 |
263 |
40 |
4.0 |
| 1983 |
314 |
51 |
2.4 |
| 1997 |
374 |
60 |
4.3 |
| 2015 |
830 2 |
453 |
25.3 |
1 Carey, M., 2010, op. cit.
2 Nelson Santillán Portilla, Autoridad Nacional del Agua, Lima, Perú.
|
|
|
Fig. 8 Nevado Hualcán,
showing several glacial lakes on its west side.
|
Role of glacier melt.
The growing role of melt during the dry season may be surmised.
Overall, runoff has three sources: (1) melting of glaciers,
(2) direct runoff, which comes from precipitation, and (3) baseflow.
In the Cordillera Blanca, Baraer et al. (2008) have reported significant
differences between the composition of the average annual runoff and that
corresponding to the dry season. For example, in Lake Querococha (Fig. 7),
data from Baraer et al. (op. cit.) indicate that during the dry season melt volume
is half the volume of runoff (50%), while the average annual volume of melting
is only a quarter (25%) (Table 4) .
Table 5. Annual vs dry-season differences in
runoff sources
in the Yanamarey watershed.
|
|
Timespan/ Season | Period |
Runoff source (%)
|
| Melt |
Surface runoff |
Baseflow |
| Annual |
1998-1999 |
25 |
60 |
15 |
| Dry season |
June-August 1998 |
50 |
3 |
47 |
|
Social impact. The glaciers of the Cordillera Blanca have sustained the population of
the Upper Rio Santa
for millennia
(Pearsall, 2008). The entire
region is referred to locally as
the Callejon de Huaylas (Huaylas Corridor), due to its elongated shape along the river,
flanked by the White Range to the east and the Black Range to the west (Fig. 4).
The population, consisting of about 320,000 people,
is distributed among hundreds of small rural settlements,
with approximately half of the people living in major urban clusters along the Rio Santa,
including the cities of Huaraz, Yungay,
Caraz, Carhuaz, and Recuay.
Huaraz, a major urban center, with about 120,000 people, is the capital of the department of Ancash (Fig. 9).
|
Fig. 9 The city of Huaraz, in the Callejon de
Huaylas.
|
|
Glacial lake outburst floods.
The danger of glacial lake outburst floods (GLOF) and avalanches
remains a threat in the White Range, and very likely to be exacerbated by continuing global climate change.
Table 6 documents the most important glacial lake outburst floods of the past 75 years.
Carey (2010) has documented a total of twenty-nine (29) GLOFs
since the year 1725, with the majority of them (26) occurring in the past century alone (since 1917).
The cities affected have been Huaraz, Yungay, Caraz, Carhuaz, Huallanca, and Chavín de Huantar.
Table 6. Important glacial lake outburst floods in the White Range in the past 75 years.
|
|
Yr/mo/dy |
Glacier |
Source maximum elevation
(m) |
Lake |
Affected
city |
Effect |
| 1941 December 13 |
Palcaraju |
6,175 |
Palcacocha
Fig. 9 (a) |
Huaraz |
15-m high debris flow avalanche
descended on the capital city, killing 5,000 people |
| 1945 January 17 |
Huantsán |
[Not determined] |
Ayhuiñaraju and Carhuacocha |
Chavín de Huantar |
1 million m3 of
water, ice, and debris buried the ruins at Chavin and destroyed two-thirds of the town, killing 500 people |
| 1950 October 20 |
Alpamayo |
5,615 |
Jankarurish
Fig. 9 (b) |
Huallanca |
3.5 million m3
of water, ice, and snow destroyed important hydroelectric infrastructure along the Santa River,
killing 200 people |
| 1951 October 27 |
Artesonraju |
5,934 |
Artesoncocha
Fig. 9 (c) |
Caraz |
Outburst flood sent 2.8
million m3 of water into Lake Parón, threatening Caraz |
1954
June
18 |
Tullparaju |
5,825 |
Tullpacocha
Fig. 9 (d) |
Huaraz |
Outburst flood threatens Huaraz |
| 1959 December 8 |
Tullparaju |
5,825 |
Tullpacocha
Fig. 9 (d) |
Huaraz |
Outburst flood threatens Huaraz |
2003 March
19 |
Palcaraju |
6,175 |
Palcacocha
Fig. 9 (a) |
Huaraz |
Small outburst flood
threatens Huaraz and causes minor damage |
|
|
Fig. 9 (a) Palcaraju Glacier, with
Lake Palcacocha in the foreground.
|
|
Fig. 9 (b) Alpamayo Glacier, with
Lake Jankarurish in the foreground.
|
|
Fig. 9 (c) Artesonraju Glacier with Lake Artesoncocha.
|
|
Fig. 9 (d) Tullparaju Glacier with Lake Tullpacocha.
|
5. CONCLUDING REMARKS
|
Global climate change, specifically anthropogenic global warming,
threathens to upset the delicate balance of Nature,
wherein the global climate is determined by the concentration of non-diatomic
gases in the atmosphere, among them, significantly, carbon dioxide (CO2).
The sustained warming of the past 50 years has produced a host of negative effects. In this paper we
highlight the effect that global warming has had on the tropical glaciers,
including melting, recession,
and their possible eventual disappearance. This places in jeopardy the continuance of a wide
array of natural services,
among them the supply of water resources, the conservation of flora and fauna,
the aesthetics of the natural landscape, and the societal activities of tourism,
mountaineering and alpinism.
We specifically focus on the White Range of Peru, a resource of global importance and
significant aesthetic value.
Life of all kinds stands to be negatively affected by protracted global warming
and the impairment of the White Range.
|
The following conclusions are drawn from this study:
The concentration of carbon dioxide
in the atmosphere has reached 410 ppm at the present time [March 2019]. The increase has been
mostly attributed to the excessive burning of fossil fuels.
Global average surface temperatures have increased
about 0.6°C in the past 50 years.
The rise in global surface temperatures has
negatively affected the tropical glaciers, causing a decrease in aerial coverage.
The changes have been gradual, but the rate of change appears to be increasing.
Average rates of glacier recession
over the period 1930-2009 have been measured at 0.62% yr-1, and over the period 1990-2009 at
0.81% yr-1.
A recent official study [2014] has documented that the loss of glacier area in the White Range
in the period 1970-2003 has been 27%.
Glacier melting
has caused an increase in the number of glacial lakes in the White Range.
The lakes have nearly tripled in number
over the past 64 years, from 223 at the time of the first inventory (1953), to more than 800 at the present time (2021).
Continuing glacier melting poses a significant threat
of glacial lake outburst floods (GLOF). The latter consist of water, snow, ice, and debris.
If not adequately controlled, these disastrous events will spell havoc
and destruction in the communities located directly in the path of the floods.
Urban relocation, although a sensible decision in the eyes of many,
remains politically difficult.
Many of these
devastating floods have
occurred in the White Range in the past 100 years (26 of them), and the chances are that they will continue to recur.
Relevant scientific understanding, coupled with enlightened
interdisciplinary management, is necessary for the government of Peru and its partners in the
international community to develop an effective
strategy to
cope with these threats.
Sustainability being clearly out of the question at this time, the aim
remains to mitigate/reduce
the effects of global warming within the next one to two generations.
|
|
REFERENCES
Ames, A., and B. Francou. 1995. Cordillera Blanca - Glaciares en la historia. Bull. Inst. fr. études andines, Vol. 24(1): 37-64.
Autoridad Nacional del Agua. 2014. Inventario de glaciares del Perú. Unidad de Glaciología y Recursos Hídricos, UGRH-Huaraz,
2da actualización.
Arrhenius, S. 1896. On the influence of carbonic acid in the air upon the temperature
of the ground. Philosophical Magazine and Journal of Science, London, Edinburgh, and Dublin,
Series 5, Volume 41, April, 237-276.
Baraer, M., J. M. McKenzie, B. Mark, and J. Bury. 2008. Climate change related evolution of water resources in the Cordillera
Blanca, Peru. The Andes: Challenge for the geosciences, in EGU topical conference series,
4th Alexander von Humboldt International Conference, Santiago, Chile.
Baraer, M., B. G. Mark, J. M. Mckensie, T. Condom,
J. Bury, K-I Huh, C. Portocarrero, J. Gomez, and S. Rathay. 2012. Recesión de glaciares y recursos hídricos
en la Cordillera Blanca del El Perú.
Journal of Glaciology, Vol. 58, No. 207, 1-18.
Bury, J. T., B. G. Mark, J. M. McKenzie, A. French, M. Baraer, K. I. Huh, M. A. Zapata Luyo,
and R. J. Gómez López. 2010. Glacier recession and human vulnerability in the Yanamarey watershed of the
Cordillera Blanca, Peru. Climatic Change, Springer, DOI 10.1007/s10584-010-9870-1.
Carey, M. 2010. In the shadow of metling glaciers: Climate change and Andean society.
Oxford University Press.
Data Bank on the Glaciers. 2015.
Data bank on the glaciers of the White Range of Peru.
San Diego State University, California.
Pearsall, D. M. 2008. Plant domestication and the shift to agriculture in the Andes.
In Handbook of South American Archaeology, H. Silverman and W. H. Isbell, editors, Springer,
New York, 105-120.
Ponce, V. M. 2011. Global warming science: Good, bad, or ugly? Online article.
Racoviteanu, A. E., Y. Arnaud, M. W. Williams, and J. Ordoñez. 2008. Decadal changes
in glacier parameters in the Cordillera Blanca, Peru, derived from remote sensing.
Journal of Glaciology, Vol. 34, No. 186, 449-510.
Vuille, M. 2013. El cambio climático y los recursos hídricos en los Andes tropicales.
Banco Interamericano de Desarrollo, Unidad de Salvaguardias Ambientales, Nota Técnica # IDB - TN - 517, Marzo, 29 p.
|